In modern development, nothing is more valuable than data — but how do you make it work for you?
Monitoring has long evolved beyond simple dashboards and graphs to become the foundation for decision-making: from fixing errors to strategic initiatives. In this post, Noveo .NET & C# Developer Ruslan demonstrates how Grafana — a top-tier monitoring platform — helps teams avoid drowning in numbers and instead extract meaningful insights.
Why Monitor Web Applications?
Application monitoring isn’t just about dashboards and graphs — it’s the basis for technical and product decisions. A well-designed monitoring strategy helps identify bottlenecks, prevent incidents, optimize performance, and understand user behavior.
What Is Grafana?
Grafana is one of the most popular tools for metric visualization and analysis. It’s flexible, scalable, easily integrates into modern DevOps processes, and is widely used by both startups and enterprises.
Grafana itself doesn’t collect metrics — it visualizes them from various sources. So, while it won’t provide logs, it can visualize existing ones. Below are some supported data sources:
|
Type |
Examples |
|
Metrics |
Prometheus, InfluxDB, OpenTelemetry |
|
Logs |
Loki, Elasticsearch |
|
Traces |
Tempo, Jaeger |
|
SQL Data |
PostgreSQL, MySQL, Clickhouse |
|
Cloud Services |
CloudWatch, Azure Monitor, GCP Monitoring |
What Should You Monitor?
- Performance
- API response time (avg, P95, P99)
- Requests per second (RPS)
- Page load time (Time to First Byte, Total Load)
- Errors & Failures
- HTTP 4xx/5xx status codes
- Database/cache connection errors
- Timeouts or failures of external services
- User Behavior
- Number of unique users
- Geography and devices
- User journey analysis
- Infrastructure
- CPU, RAM, and disk usage
- Number of open connections
- Kafka / RabbitMQ queue depth
- Business Metrics
- Number of sign-ups / orders
- Conversion rates at funnel stages
- Revenue by day or region
It’s crucial to remember: there’s no one-size-fits-all approach to monitoring. If you’ve built a “universal” dashboard, ask someone else if they understand it. Chances are, you’re the only one who does.
Dashboard Examples
You don’t always need to build dashboards from scratch — it can be time-consuming. Start by exploring existing solutions that might meet your needs.
Grafana’s official dashboard library offers many options for different data sources, panels, and services.
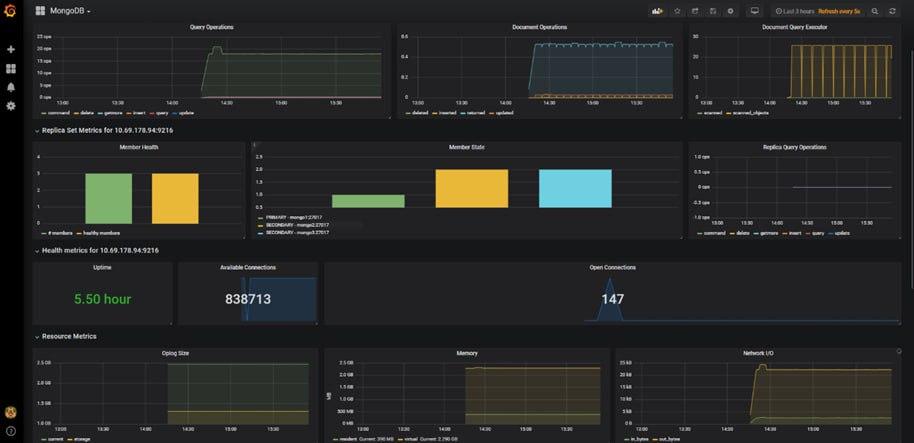
MongoDB Dashboard: Track query counts (categorized by delete, insert, query, etc.) and database connections.
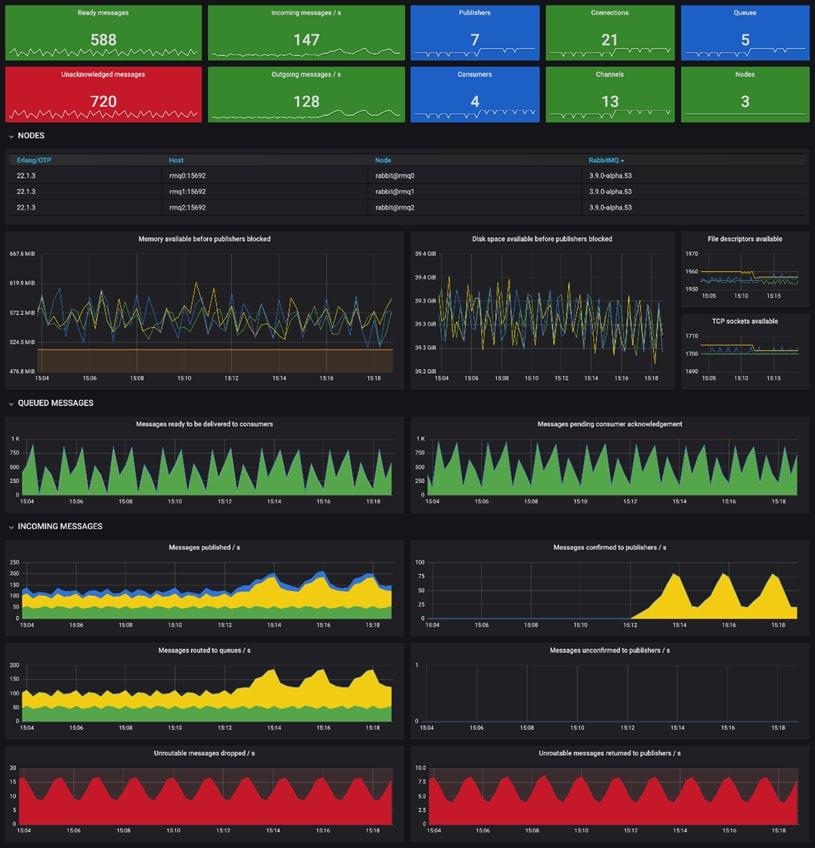
RabbitMQ Dashboard: Monitor queues and message rates.
You can customize any dashboard to fit your requirements. For a deep dive into building your own, check out Grafana’s official guide.
Dashboard Design Tips
- Divide Responsibilities
- Developers: API performance, errors, latency.
- DevOps: Infrastructure, network metrics.
- Product: User behavior, business metrics.
- Use Variables
- $region, $service, $env help quickly switch contexts.
- Add Descriptions
- Explain what a metric means and its expected range.
- Set Default Time Ranges
- Use presets like 1h, 6h, 24h.
- Avoid Clutter
- Don’t duplicate metrics; keep dashboards clean.
Grafana Alternatives
Grafana isn’t the only tool out there. Here are some alternatives:
- Kibana: Best for log-heavy environments (integrates with Elasticsearch).
- Datadog: Full-stack monitoring (SaaS, no self-hosting).
- Metabase: Business-centric SQL dashboards and reports.
- Redash: SQL-focused, ideal for PostgreSQL/MySQL environments.
Conclusion
Grafana isn’t just “pretty graphs” — it’s a powerful tool for monitoring, analytics, and incident response. Its flexibility and scalability make it suitable for startups and enterprises alike. The key isn’t just to install it but to integrate it into your development and support processes based on your specific needs.