Three Letters of Reliability: SLI, SLO, and SLA
SLI, SLO, and SLA: let's break down how they differ and how they relate to each other.
more
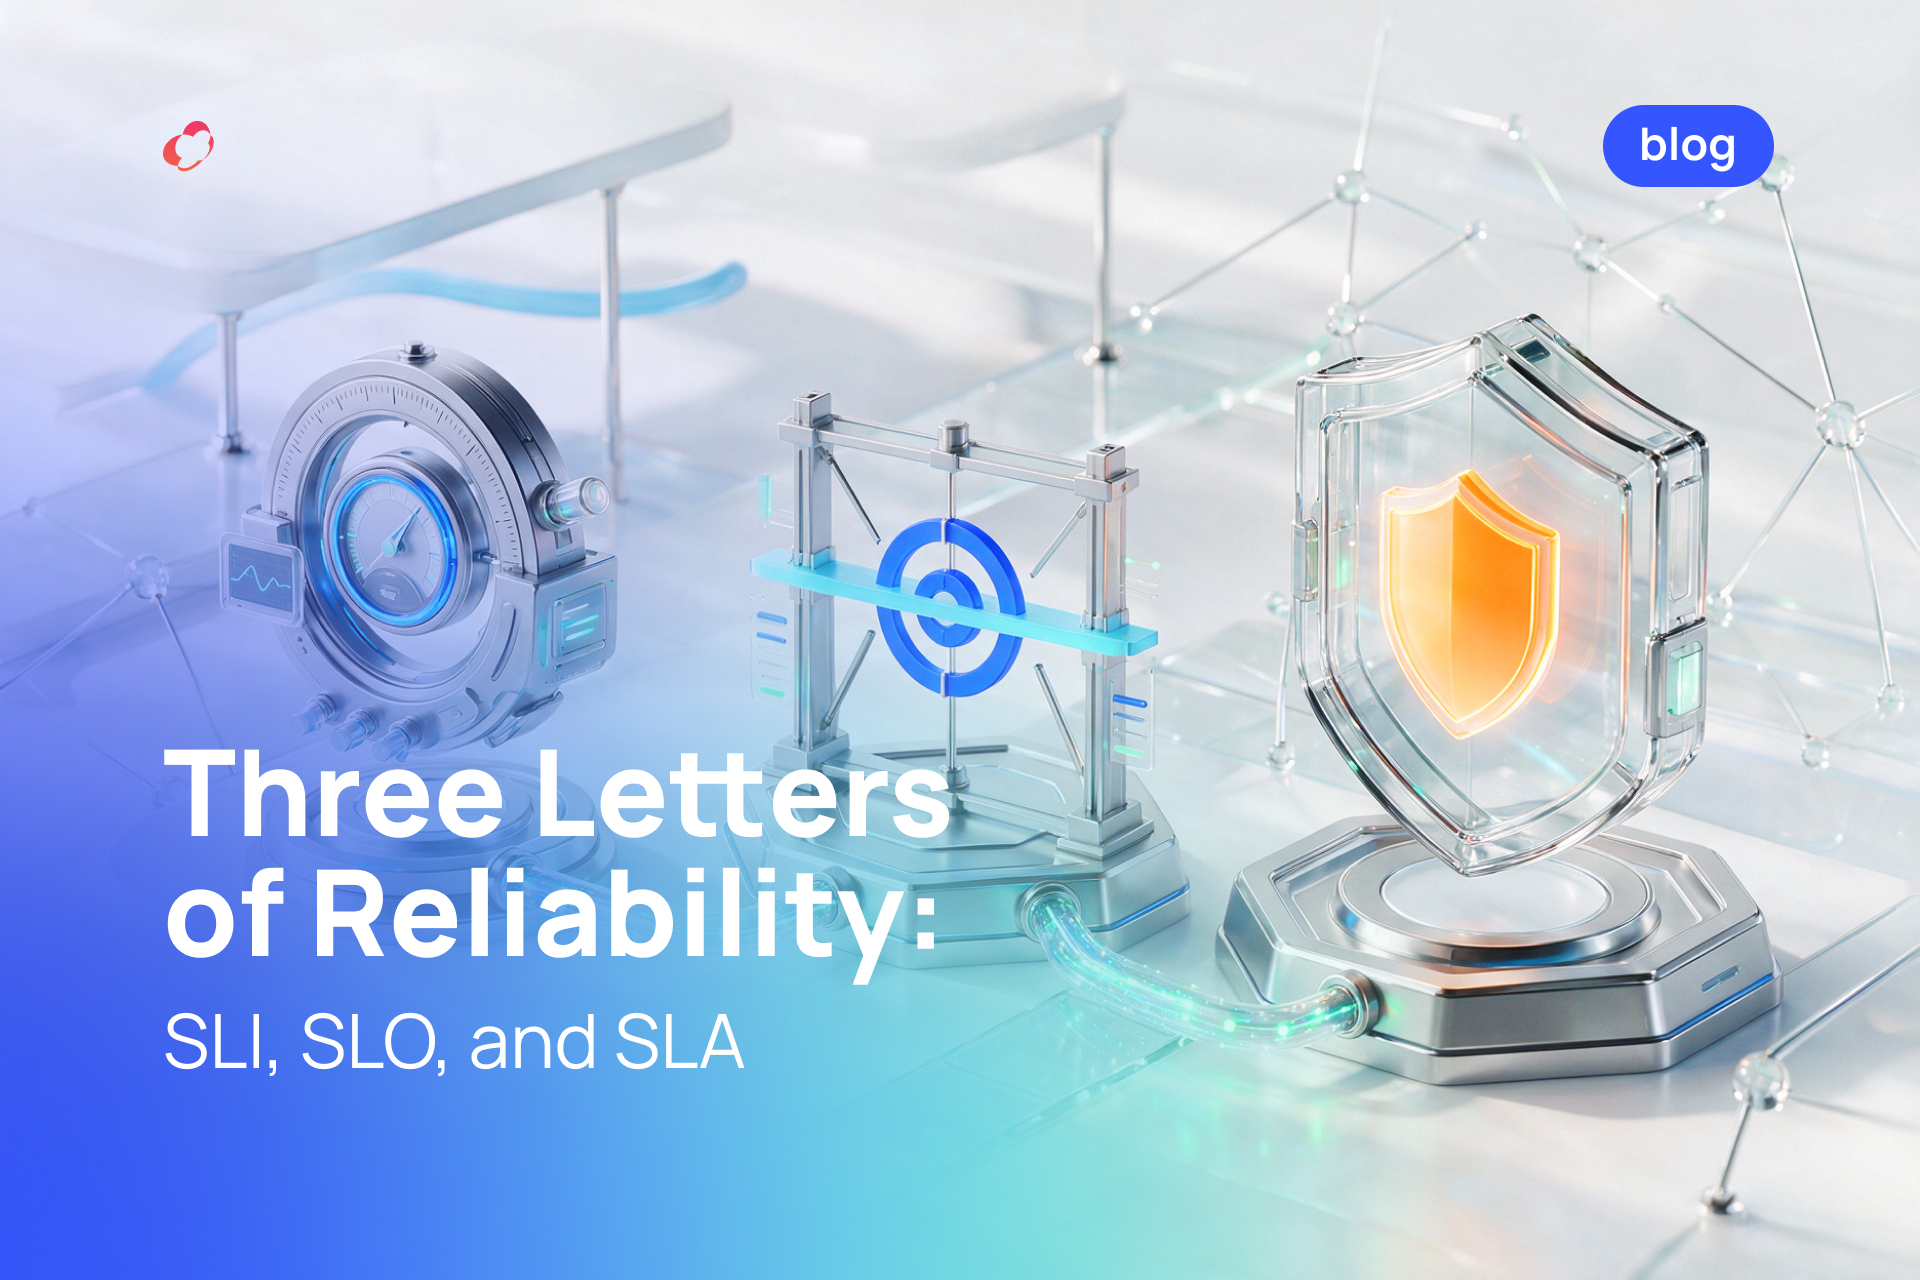
SLI, SLO, and SLA: let's break down how they differ and how they relate to each other.
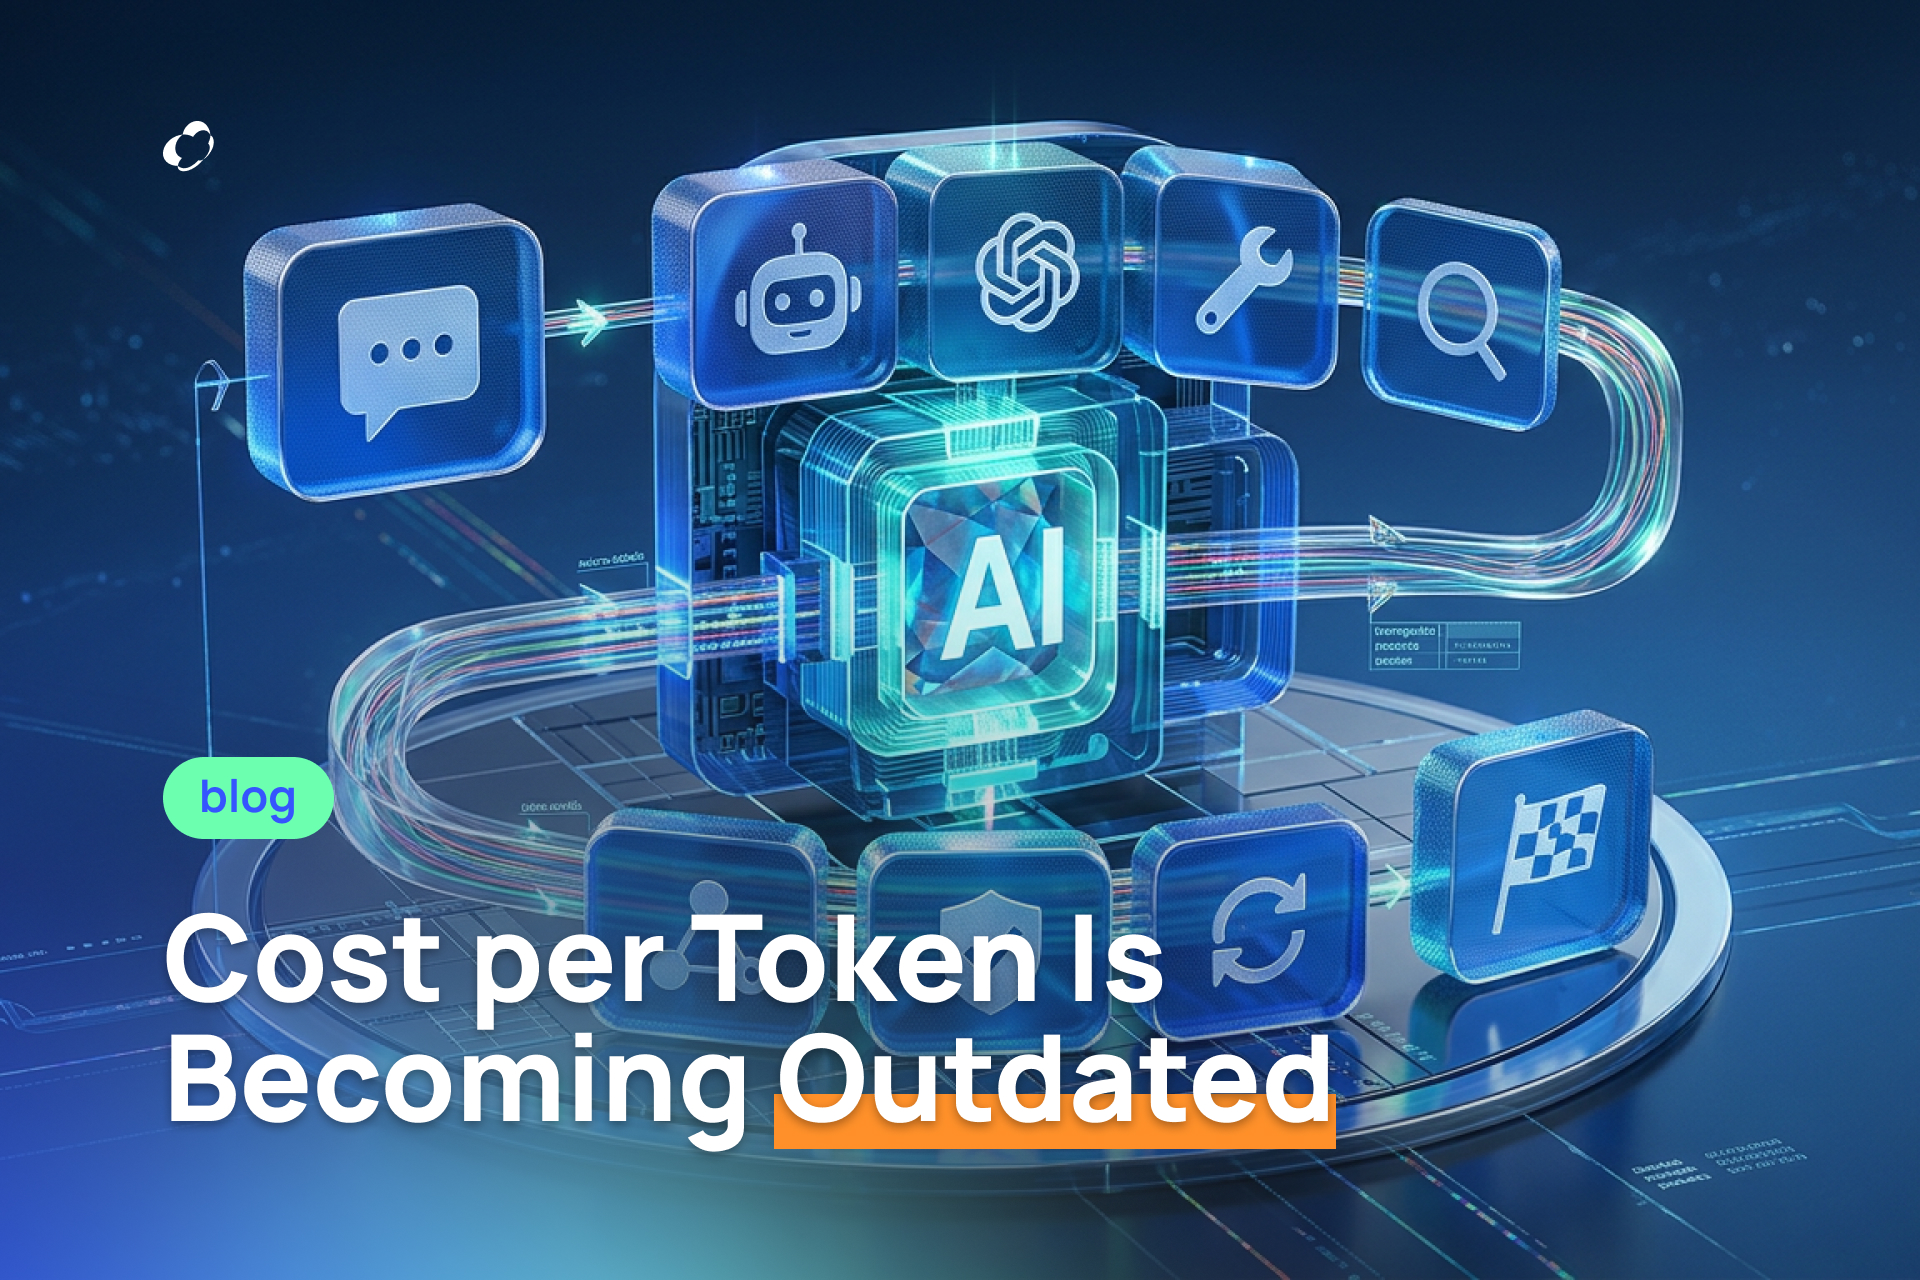
When it comes to the cost of AI, the first question is almost always the same: how much does a token cost? It's a logical question, especially when choosing between models. But the more complex AI systems become, the less the price of a token says about the real cost of a task.
Can AI fully take over routine tasks, and at which stages does it prove useless? Our design team conducted a large‑scale internal audit.
Noveo VirtualAgent - not just another AI coder, but a multi‑agent system with shared memory that automatically takes tasks from Jira, writes code, reviews it, and keeps documentation up to date.
At Noveo, we don't just build software — we build systems. For anything. For everything. From enterprise platforms to... a book.
Logs — check ✅, traces — check ✅, metrics are next! Andrey, Senior Developer at Noveo, continues his series of posts on monitoring.
Having configured Grafana, Loki, and Alloy for log gathering, we will move on to configuring tracing with Tempo.
In this post, we'll break down the architecture of modern agents, explore approaches to building them — from ready‑made frameworks to building from scratch — and offer practical recommendations.