For whom the article is
This article is written for all those people using Pycharm but wishing to switch to VSCode for a reason. And also for beginners not knowing how to set up the visual debugger in VSCode for Python yet.
The article is written at the request of multiple people who work with Python through dev env setups with docker-compose, and need to connect to already existing containers and start dealing with Python efficiently in it.
In the article, we also cover the ability to run visual debug for specific unit tests, and stress the importance of doing it, because it helps us have comfortable entry points into our code with maximum visibility. That makes test-driven development very plausible, or at least development when tests are written at the end of an atomic change made by pull request, for the reasons of having the ability to see rapid feedback and trying to write your code parts literally from within unit tests.
The main point of the article is to guide people to set up things for working with Python for Django in already running Docker containers. Additionally, we provide an explanation of how to do it without Docker, and some instructions for Fastapi, and Flask for comparison. This article was designed for someone who possesses a basic understanding of how to use pip and venv. However knowledge of VSCode isn’t a requirement for a reader to get the point of the article.
All examples in the article are in the examples folder. We assume you’re opening VSCode with the working directory set to a specific example folder (e.g., examples/simple_pyscript or examples/django_example) so that the .vscode folder is at the project root.
P.S. Normally, reopening workdir with “code -r .” is not required, as we open projects only once, but we will be often using it in this article to switch between multiple working directories when necessary.
Python without Docker
- We assume the use of a flat Python structure, because it makes for a more convenient setup configuration of library imports in the project, and allows everything to work with fewer commands right away.
- We also assume we will be utilizing unit testing :]
- As mentioned, we assume you will be opening as “Working Directory” specific example folders like examples/simple_pyscript.
- “code -r .” shortcut allows for a quick reopening of VSCode with a changed working directory. That is necessary for the settings of another project directory to take place in the same instance. Usually, people do it by opening multiple instances of VSCode, running `code .` command in each project and closing no longer needed instances.
- We also assume you are using Linux as a main OS, or at least using WSL2 with linux opened inside if you are developing at Windows or MacOS.
- (the article material has been tested to work on Kubuntu 22.04 LTS)
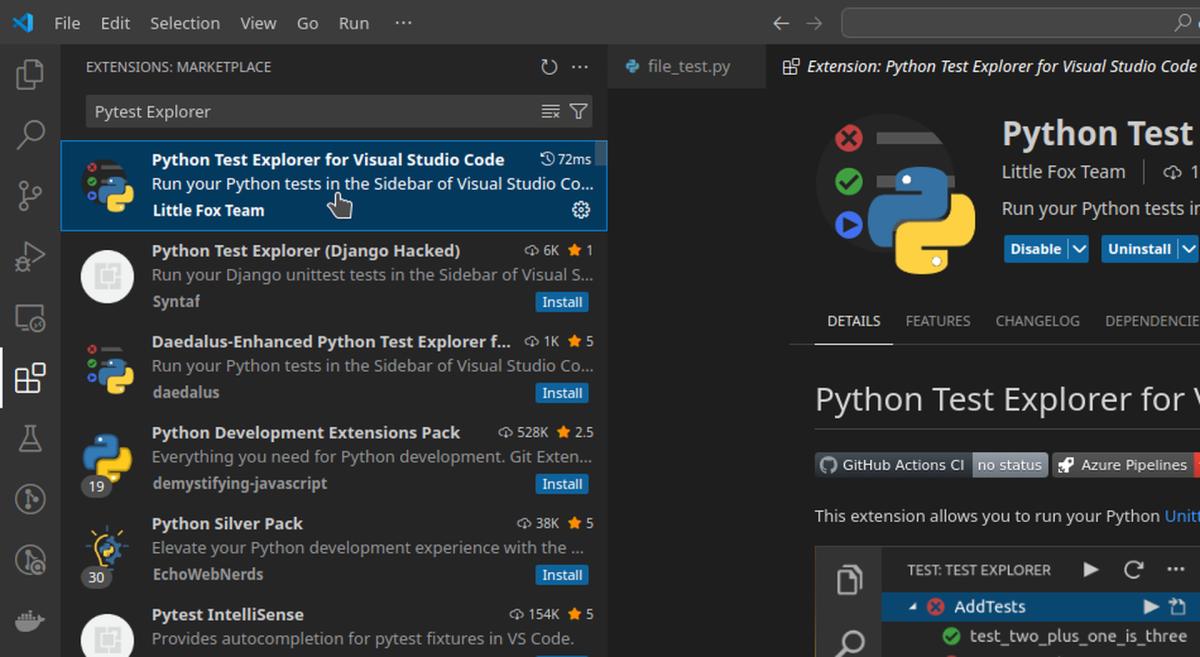
First, ensure you installed the Pytest Explorer extension. It will auto install the Python extension for IntelliSense along the way.
- pytest explorer id for search is @id:littlefoxteam.vscode-python-test-adapter
- it will auto install the Python extension along side: @id:ms-python.python
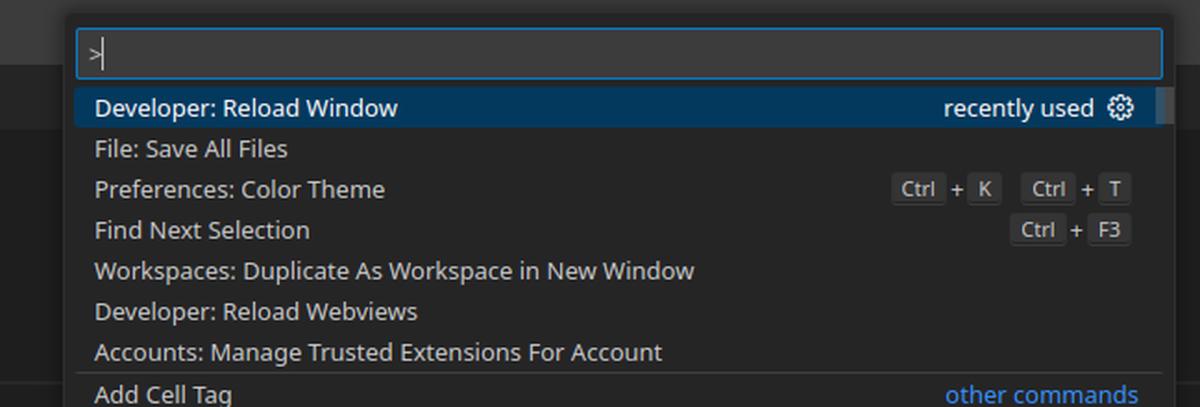
If something is working weirdly, for example the syntax colour highlights are not there , make sure to run Ctrl + Shift + P and write Reload Window. Select and apply, so it quickly reloads vscode and the extensions.
After that simple Python file debugging is launchable as git clone/download https://github.com/darklab8/blog/tree/master/
git clone https://github.com/darklab8/blog.git
cd blog/blog/articles/article_detailed/article_visual_debugger_in_vscode/examples
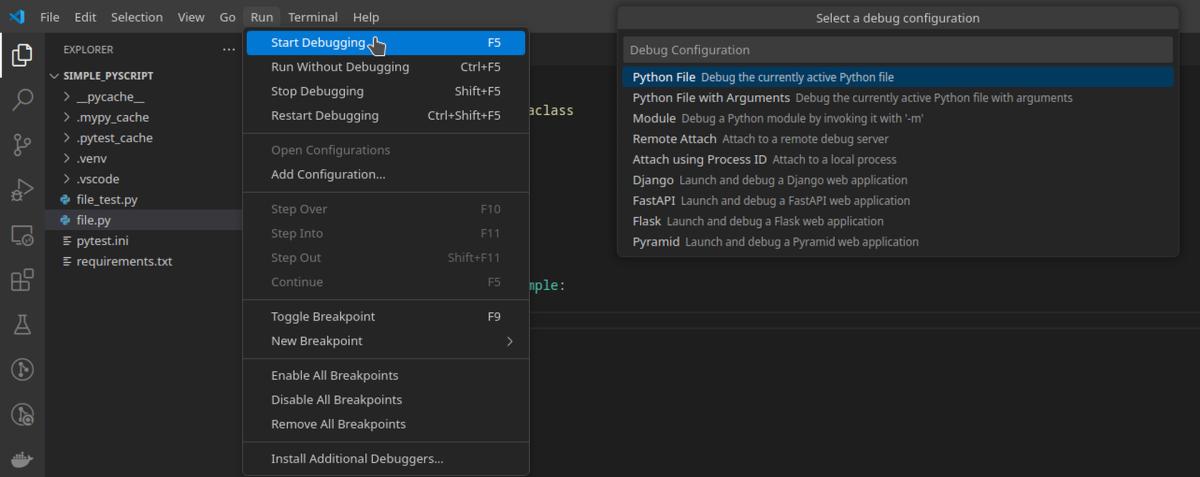
cd simple_pyscript && code -r # will reopen to different workdirIn the left sidebar, click on file.py in the directory tree. Select in the top menu: Run -> Star Debugging (F5)
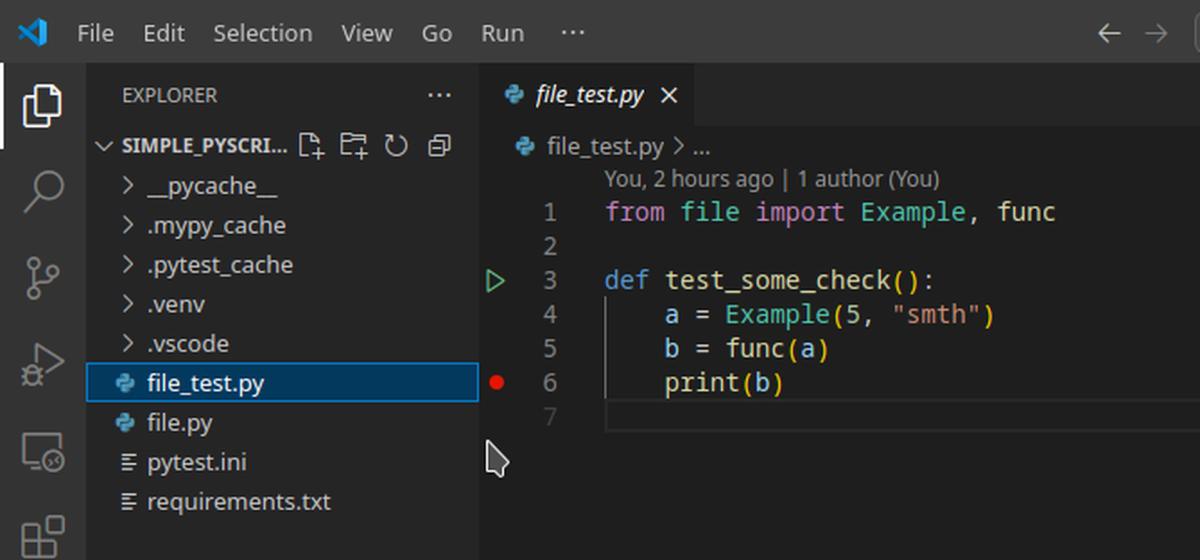
Now let’s check if it is working for pytest test debug:
# create venv

python3 -m venv .venv

# activate

source .venv/bin/activate # at windows can be `venv\Scripts\activate`

pip install -r requirements.txt
Select a new venv in VSCode using one of these methods:
- Click the interpreter in the bottom-right corner and select .venv/bin/python3 manually if needed.
- On Linux: Ctrl + Shift + P > Enter interpreter path
- On Mac: CMD + P > Python: Select Interpreter
If something glitches, we do the Ctrl + Shift + P -> Reload Window trick
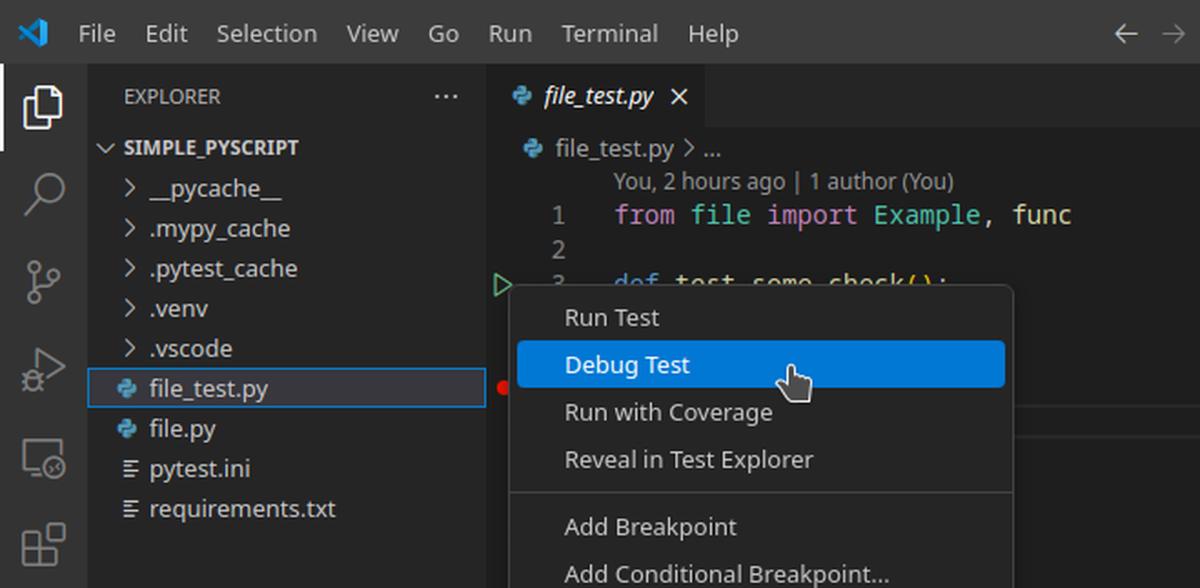
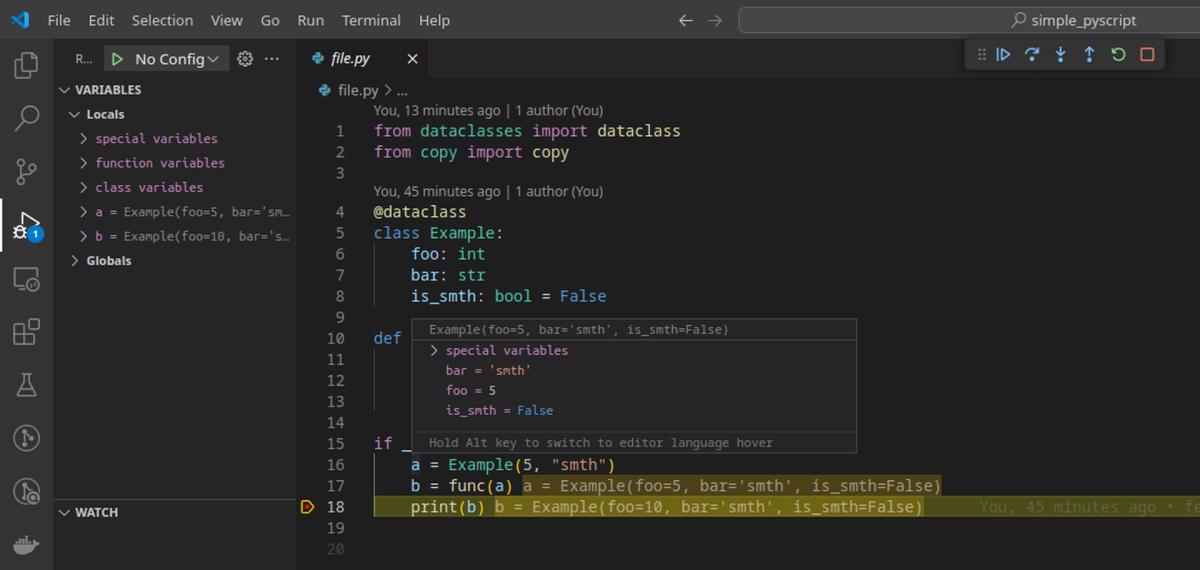
Basic functions of a visual debug in vscode
- on hover you see data. You can open the nested data inside
- F10 step forward
- F11 step forward and deeper
- F5 continue
- use the mouse to set red breakpoints around
Python with settings for env vars
cd ../simple_py_with_settings && code -r .
You can update .vscode/settings.json to set up your debug parameters.
cat .vscode/settings.json
will show content:
{
"python.testing.pytestArgs": [
"."
],
"python.testing.unittestEnabled": false,
"python.testing.pytestEnabled": true,
"terminal.integrated.env.linux": {
"SOME_VAR": "abc"
},
"terminal.integrated.env.windows": {
"SOME_VAR": "abc"
},
"terminal.integrated.env.osx": {
"SOME_VAR": "abc"
}
}
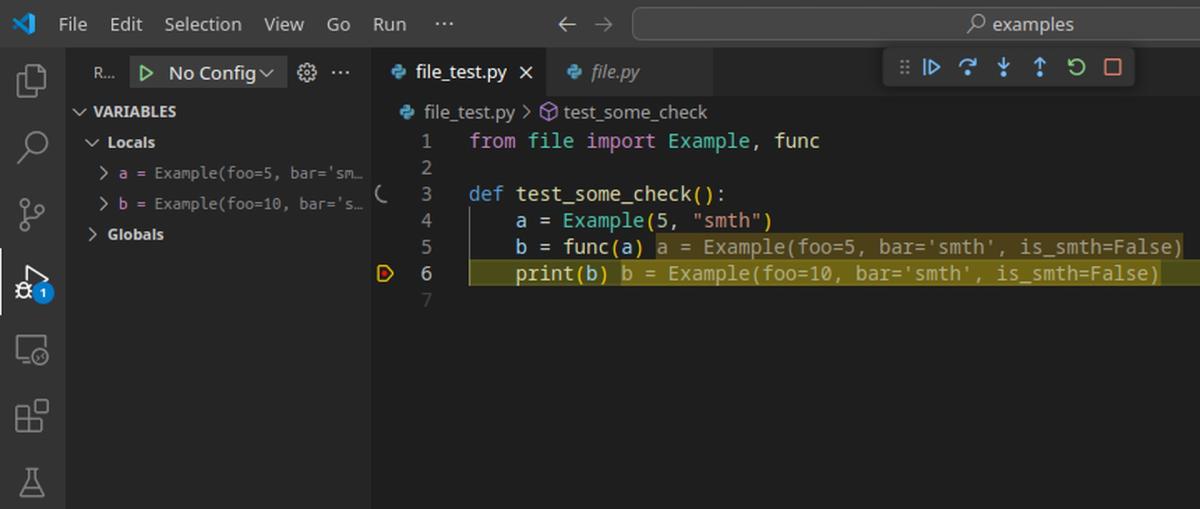
$ python3 file.py
Example(foo=10, bar='abc', is_smth=False)
Those environment variables will be available for access from within the launched web server and unit tests during the visual debug usage too.
Python with running debug for django
cd ../django_example && code -r .
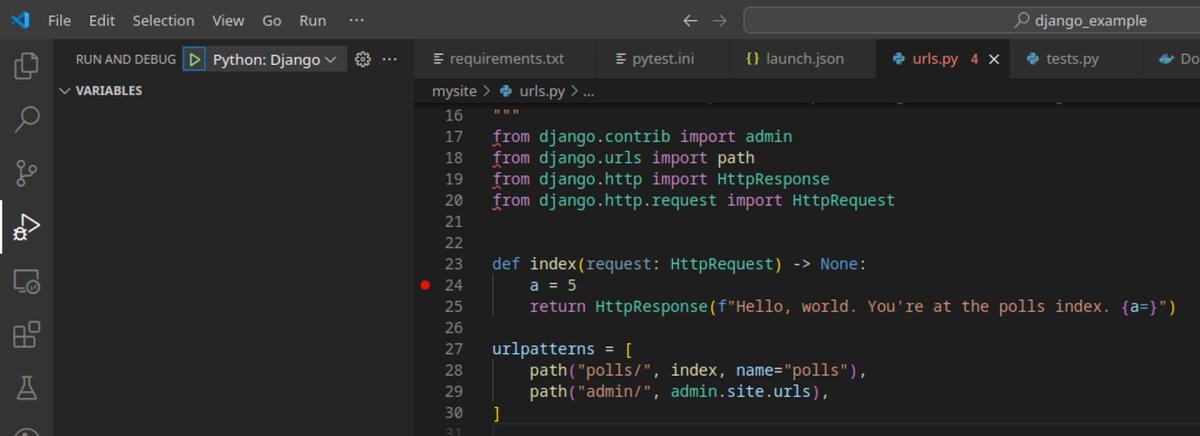
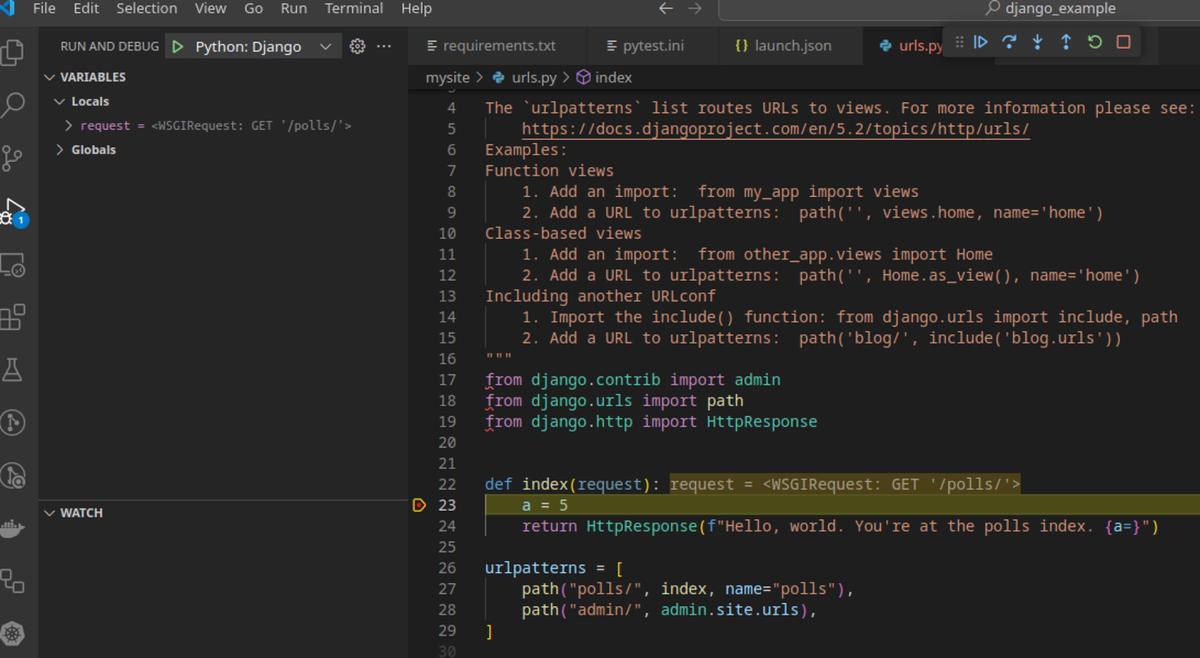
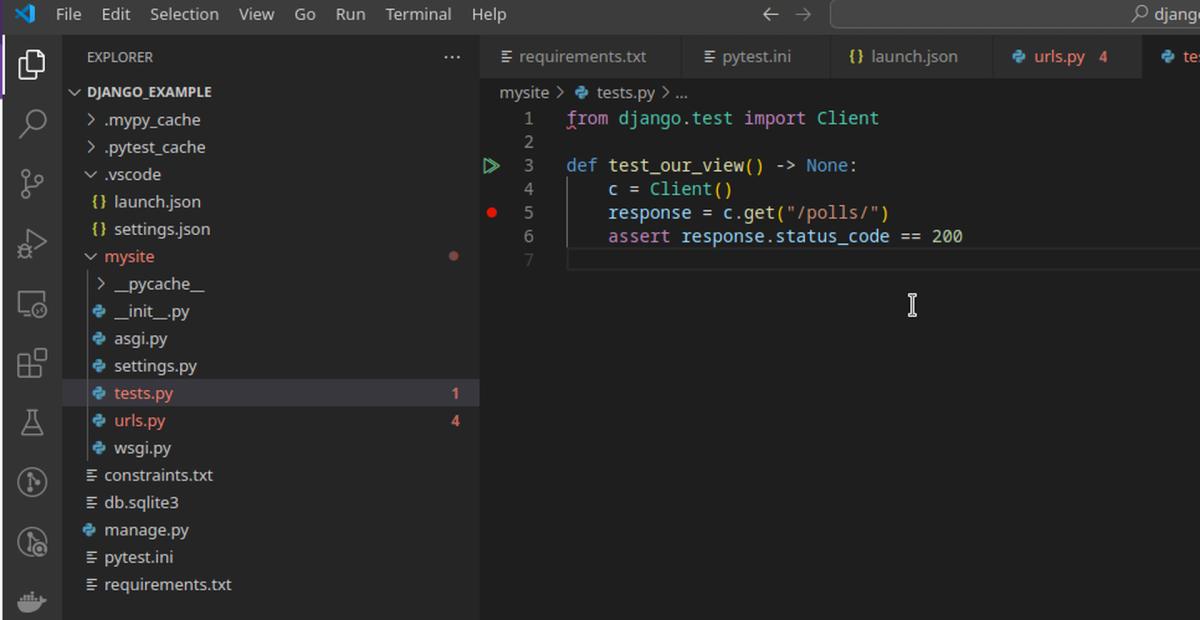
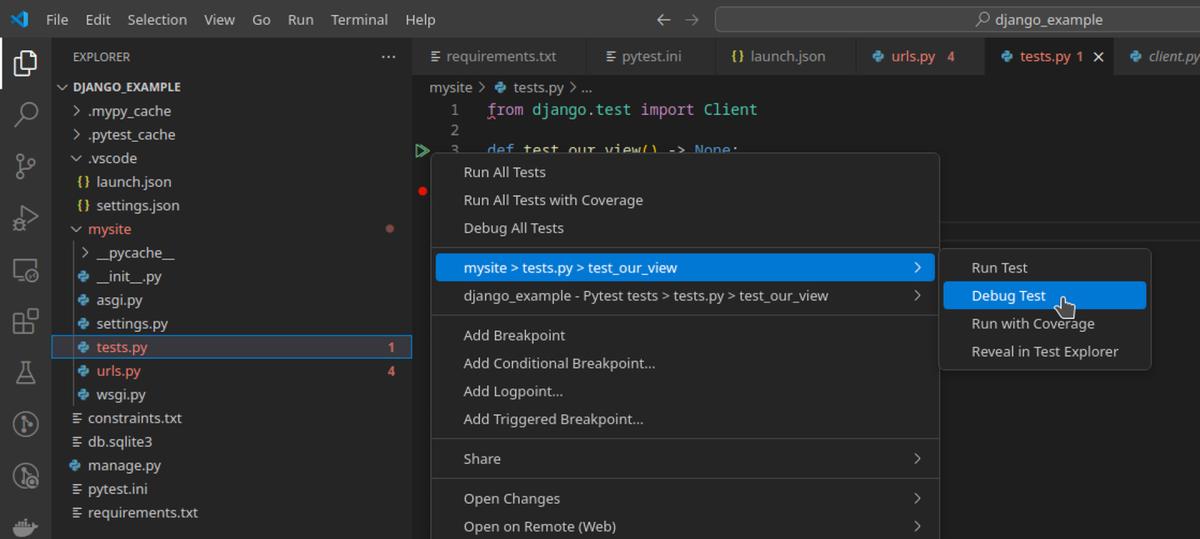
Set a breakpoint in a view at urls.py and launch Python Django debug, like in the picture below
Debug for Django will work due to the present .vscode/launch.json containing
{
	// Use IntelliSense to learn about possible attributes.
	// Hover to view descriptions of existing attributes.
	// For more information, visit: https://go.microsoft.com/fwlink/?linkid=830387
	"version": "0.2.0",
	"configurations": [
    	{
        	"name": "Python: Django",
        	"type": "debugpy",
        	"request": "launch",
        	"program": "${workspaceFolder}/manage.py",
        	"args": ["runserver", "0.0.0.0:8000"],
        	"django": true,
        	"justMyCode": false
      	},
    	{
        	"name": "Python: Debug Tests", // KO with GUI (tests tab)
        	"type": "debugpy",
        	"request": "launch",
        	"program": "${file}",
        	"purpose": ["debug-test"],
        	"console": "integratedTerminal",
        	"justMyCode": false
    	},
    	{
        	"name": "Debug specific tests", // OK with F5
        	"type": "debugpy",
        	"module": "pytest",
        	"request": "launch",
        	"purpose": ["debug-test"],
        	"console": "integratedTerminal",
        	"justMyCode": false,
        	"args": ["test_sample.py::test_answer"]
    	},
    	{
        	"name": "Python: Current File", // OK with F5
        	"type": "debugpy",
        	"request": "launch",
        	"program": "${file}",
        	"console": "internalConsole",
        	"justMyCode": false
    	}
	]
}
Of all the settings, only the Python: Django section matters for running the debugger via manage.py right now. Take note that you technically can input arbitrary arguments (under args key) to run it for execution of more different stuff.
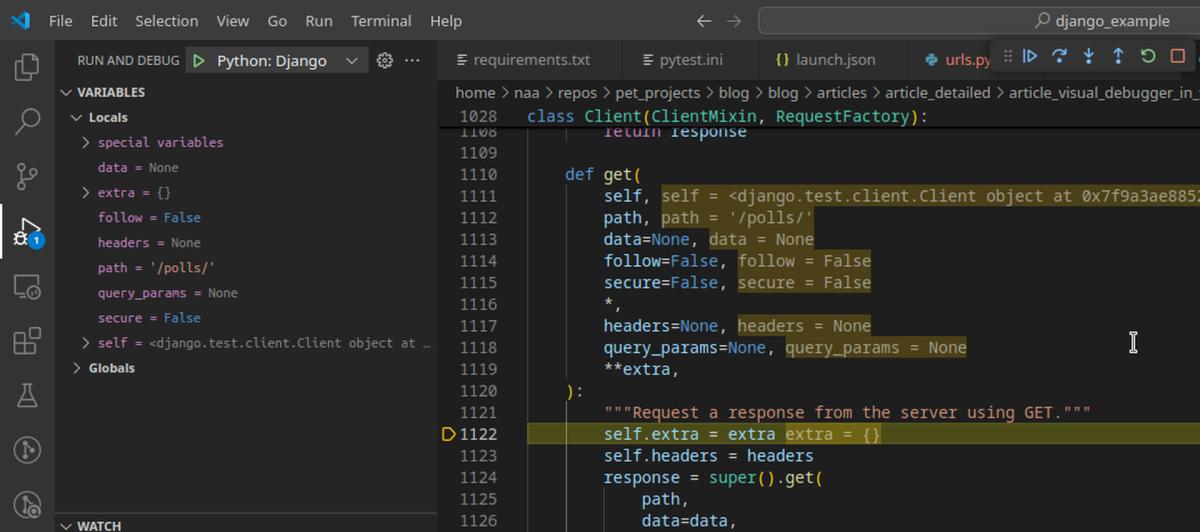
Take note of setting "justMyCode": false, it allows you to navigate during visual debug third party libs too. Otherwise, they will be skipped. These are the crucial things when debugging internal company libraries , or when developing your own library that is doing something with known third-party libraries.
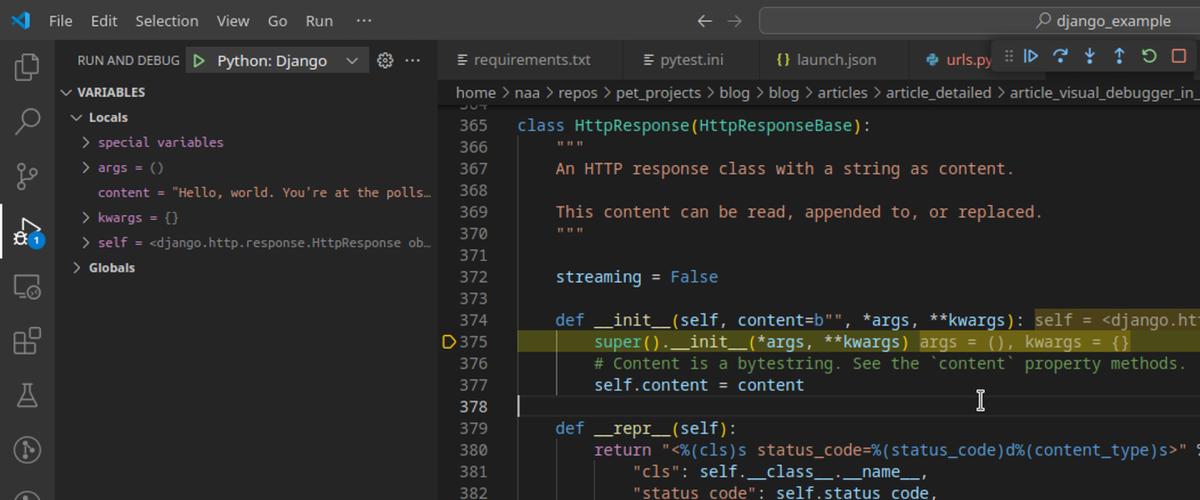
The justMyCode: false setting in launch.json allows navigation through third-party library code, even during visual debugging from unit tests.
Python with running debug for fastapi
cd ../fastapi/example && code -r .
Install packages in virtualenv again:
deactivate

python3 -m venv .venv

source .venv/bin/activate # at windows can be `venv\Scripts\activate`

pip install -r requirements.txt
with small fixes to .vscode/launch.json, we have it adapted for fastapi now
{
	"version": "0.2.0",
	"configurations": [
    	{
        	"name": "Python: Fastapi",
        	"type": "debugpy",
        	"request": "launch",
        	"program": "${workspaceFolder}/app.py",
        	"justMyCode": false
      	},
    	{
        	"name": "Python: Debug Tests", // KO with GUI (tests tab)
        	"type": "debugpy",
        	"request": "launch",
        	"program": "${file}",
        	"purpose": ["debug-test"],
        	"console": "integratedTerminal",
        	"justMyCode": false
    	},
   	 {
        	"name": "Debug specific tests", // OK with F5
        	"type": "debugpy",
        	"module": "pytest",
        	"request": "launch",
        	"purpose": ["debug-test"],
        	"console": "integratedTerminal",
        	"justMyCode": false,
        	"args": ["test_sample.py::test_answer"]
    	},
    	{
        	"name": "Python: Current File", // OK with F5
        	"type": "debugpy",
        	"request": "launch",
        	"program": "${file}",
        	"console": "internalConsole",
        	"justMyCode": false
    	}
	]
}
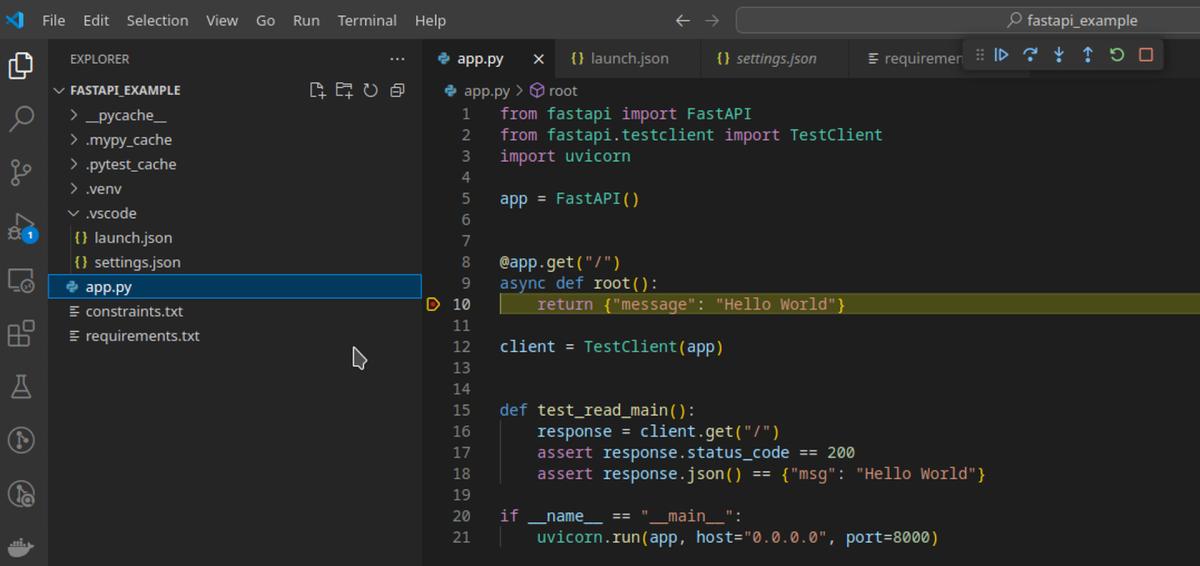
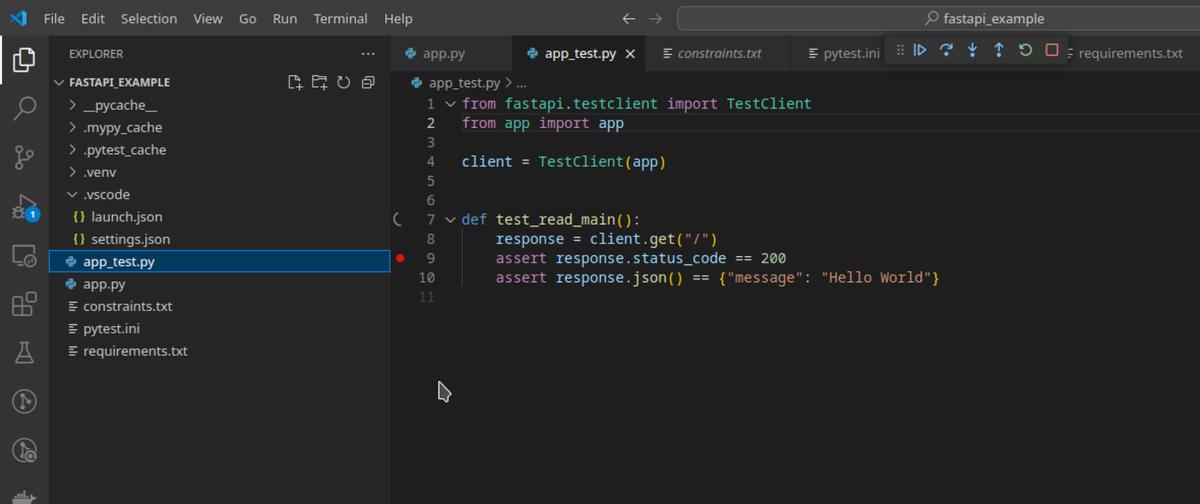
With written small code examples in app_test.py, we have no trouble launching visual debug for unit tests of fastapi
See folder flask_example for almost the same example to try for Flask too.
Python in already existing Docker
Ensure having installed Dev Containers app @id:ms-vscode-remote.remote-containers

cd ../examples/django_example

docker compose build

docker compose run --service-ports shell # `--service-ports` option ensures we forwarded 8000 port written in docker-compose despite using `run` command instead of `up`
If you want to avoid the use of docker-compose, same is achievable with regular Docker command:
docker build --tag test
docker run -it -v $(pwd):/code -w /code --name shell --entrypoint=bash test
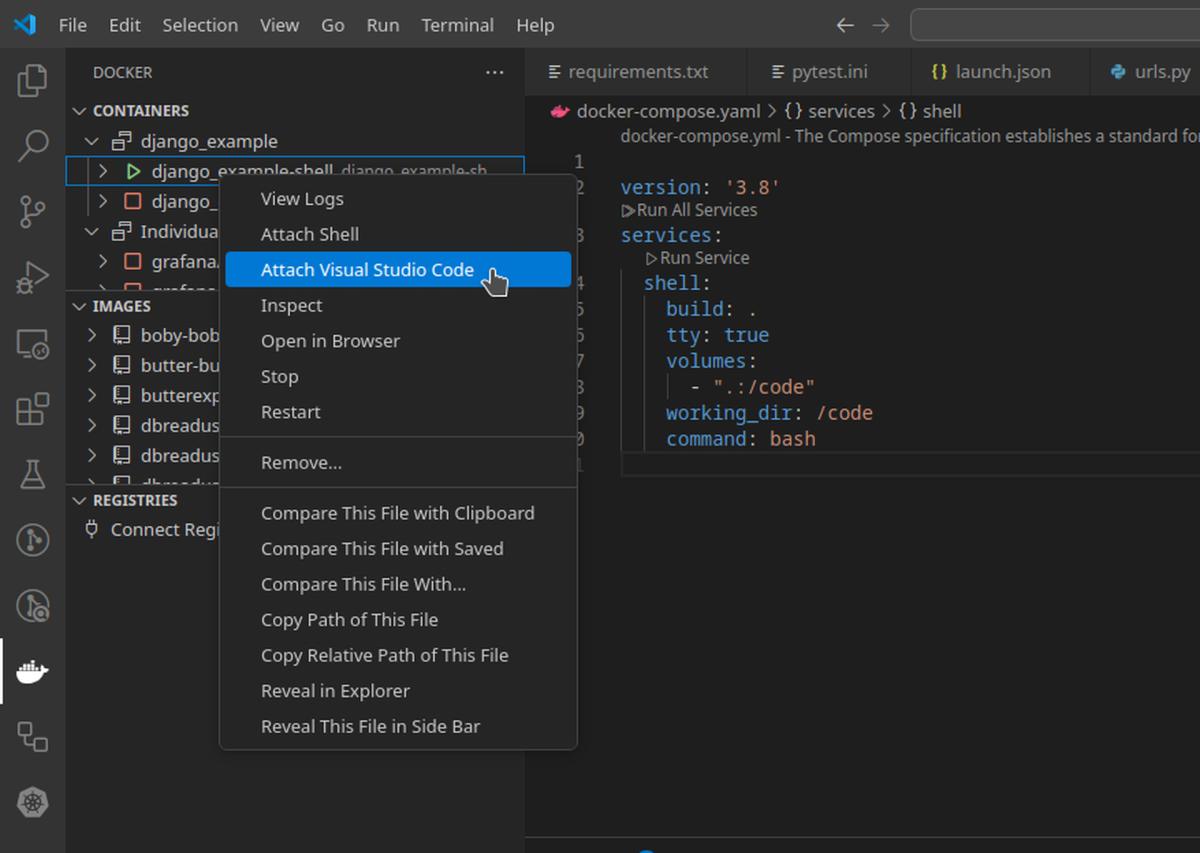
Now we can enter the already running container by using the Attach Visual Studio Code option. This option opens a second VSCode instance, running from within the container.
Install Pytest Explorer @id:littlefoxteam.VSCode-python-test-adapter (with autoinstalled Python inside).
Since the extension is installed inside a running container, you’ll need to repeat the installation each time a new container is created or started.
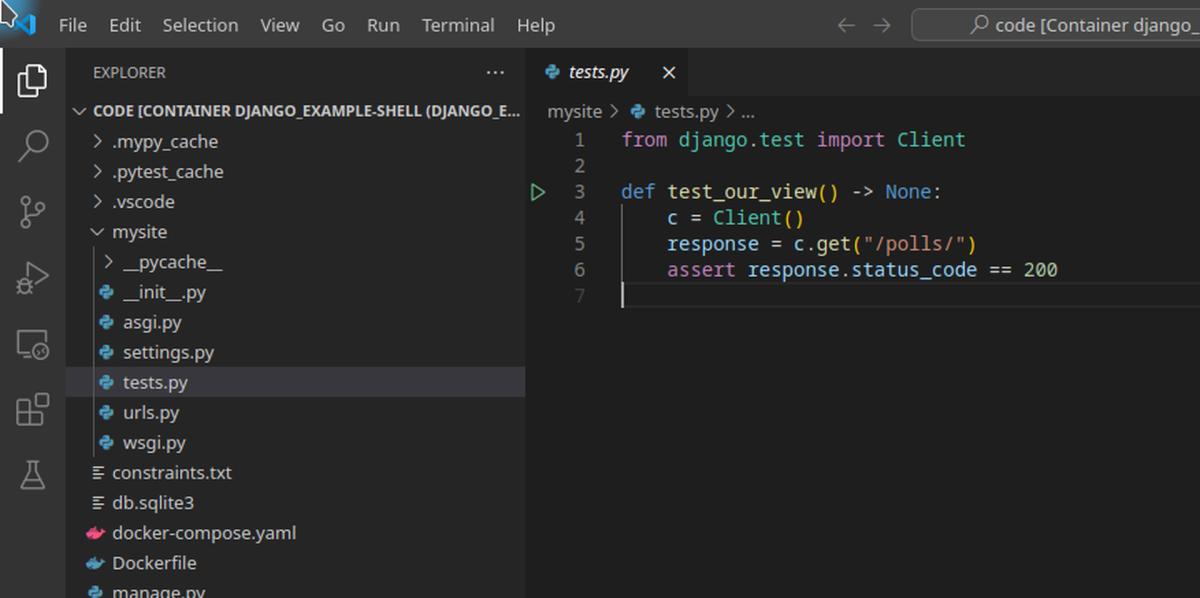
On the left sidebar choose to go to the working directory /code.
If everything is set up correctly, you’ll see green arrows next to test functions, allowing you to run them in debug mode. (Green arrow at the left of a line code).
You can also launch the web server from the Debug menu by selecting Python: Django.
To ensure that we are able to see the dev server from the container, we binded it to 0.0.0.0 instead of localhost! That is doable with python3 manage.py runserver 0.0.0.0:8000 for django, we added the missing argument into .vscode/launch.json.
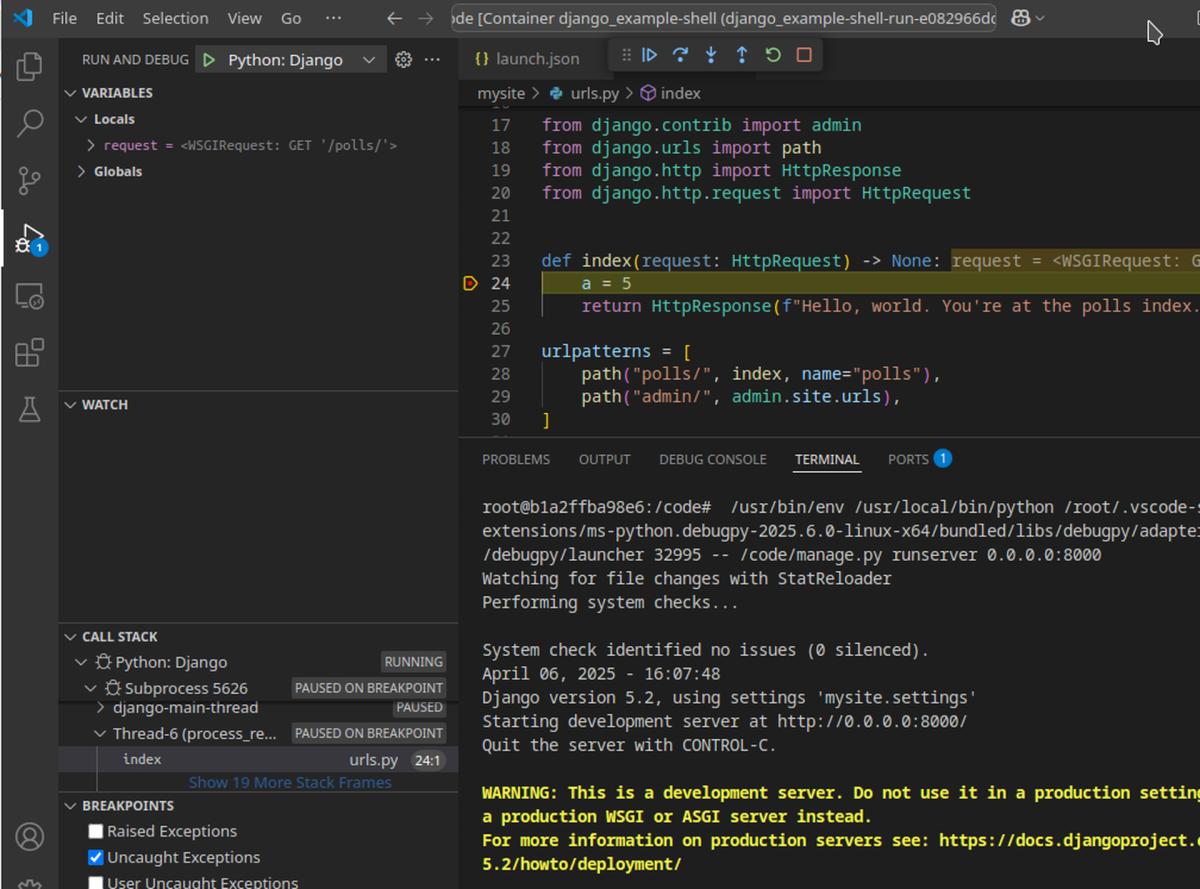
After setting breakpoint in view and visiting http://localhost:8000/polls, we are stopped at breakpoint as desired.
The same steps are doable for FastAPI and Flask. We added Dockerfile and docker-compose.yml for the same into fastapi_example and flask_example folders.
P.S. When you are in VSCode from within a container, the opened terminal is opened automatically for within the container shell.
Ending
Congratulations, now you are able to use visual debug for Python common web frameworks with or without Docker for both the web server run and unit tests!
With the examples showing how it is done for two different Python frameworks, where for fastapi we adjusted launch.json on a fly, it is my intention to teach you to see how to do it similarly for any other existing Python framework.
I encourage you to try development from within unit tests written with visual debug, since it is actually a comfortable way of introducing testing to your code writing process. Doing that will ensure the most rapid feedback, and help you write better code in all kinds of internal characteristics. Do check the books like “TDD” by Kent Beck and “Unit testing” by Vladimir Khorikov in order to find out more about unit testing that enables writing maintainable code.
We showed examples with Docker, because modern web development could be having different C dependent libraries that could be problematic to install without Docker. Also, Docker makes a universal way to set up dev environments and documents as code that helps you keep your application buildable, testable and runnable. Some companies just keep dev environments straight in Docker only for those exact reasons.
Original: https://darklab8.github.io/blog/article_visual_debugger_in_vscode.html