Intro
In the first part of the article, we configured Grafana, Loki, and Alloy for log gathering.
In this article, we will go through the configuration of tracing with Tempo. We assume that the previous system configurations were already completed in Part 1 of this article series (like the Grafana web GUI configuration and the Caddy web server, at least). Our goal remains to configure tracing for homelabs and your pet projects. At the end of the article, we will also mention some production-grade configuration tips.
What is tracing for?
Tracing is your best friend when you are monitoring backend systems that make a lot of different networking requests to databases, third-party APIs, and your own other services. Tracing shows exactly which SQL query takes the most time to execute during these requests. It can also show if your code is stuck in the common N+1 problem of the Django ORM (when you execute an SQL query for each row instead of a single one due to a forgotten select_related/fetch_related command).
What are the properties?
To fully understand tracing, it helps to look at its core characteristics and how it fits into your broader monitoring stack. Before diving into the configuration, here is a quick breakdown of what makes tracing unique:
- Tracing is somewhat comparable to profiling, but has big differences. Profiling monitors a single app only and is able to show the execution time of each function, and even memory allocations and other stuff. Tracing, in comparison, shows only what was covered in its tracing spans and is able to propagate the information shown to other services.
- Tracing serves as an EASY-TO-NAVIGATE GLUE between all monitoring systems, uniting traces with logs, logs to traces, traces to profiles, and metrics to traces. Everything is joined by traces! We can find logs by traces, and we can find metrics from traces if very desired, etc.
- Tracing can work majorly with zero application code changes, if in your language there are already written "auto-instrumenting" solutions for every sneeze that cover all the common libraries with integrations.
- That is the case with Python and its rich set of auto-instrumenting solutions.
- Regretfully, it is not the case at all with Golang at the moment of writing this article in 2026.
- How easy it is to configure tracing essentially depends on the language.
My best recommendation regarding integrating it in any language... approach problems with middlewares or universal interceptors of network requests for every network-interacting library you use. Make wrappers if necessary, which automatically add tracing spans. Your code should be covered with tracing automatically, with the least amount of effort for all network-interacting libraries—then tracing is the most useful for backend apps!
Note
We have a somewhat weak substitution for instrumentation in Go: an eBPF-based tool. However, it is highly limited; your logs and metrics will not have connections to traces, and it works only for a specific subset of libraries, which you can't easily change. We will not be covering the usage of this tool in this article series, since it does not look like a good method to go by default.
Raising Tempo
Important
We provide the Docker Compose way of configuration as a demo example because more devs are highly likely familiar and comfortable with Docker Compose than with Terraform. We utilize Terraform for configuration and recommend using it instead of Docker Compose if you can. The book "Terraform: Up & Running" is an excellent place to start with it.
docer-compose.yaml

version: '3.8'

services:
  tempo:
    build:
      dockerfile: ./Dockerfile.tempo
      context: .
    container_name: tempo
    user: root
    entrypoint: ["sh", "-c"]
    command: ["/tempo -config.file=/etc/tempo.yaml"]
    networks:
      grafana:
        aliases:
          - tempo
    restart: always
    logging:
      driver: json-file
      options:
        mode: non-blocking
        max-buffer-size: 500m
    volumes:
      - tempo_data:/var/tempo
    mem_limit: 1000m

  alloy-traces:
    build:
      dockerfile: ./Dockerfile.alloy.traces
      context: .
    container_name: alloy-traces
    entrypoint: ["/bin/alloy"]
    command: ["run","/etc/alloy/config.alloy","--storage.path=/var/lib/alloy/data"]
    restart: always
    logging:
      driver: json-file
      options:
        mode: non-blocking
        max-buffer-size: 500m
    volumes:
      - /var/run/docker.sock:/var/run/docker.sock:ro
    networks:
      grafana:
        aliases:
          - alloy-traces
    mem_limit: 1000m

volumes:
  tempo_data:
    name: "tempo_data"

networks:
  grafana:
    name: grafana
    external: true


main.tf

# Option to raise as Terraform
terraform {
  required_providers {
    docker = {
      source  = "kreuzwerker/docker"
      version = ">=3.0.2"
    }
    grafana = {
      source = "grafana/grafana"
    }
  }
}

provider "docker" {
  host     = "ssh://homelab"
  ssh_opts = ["-o", "StrictHostKeyChecking=no", "-o", "UserKnownHostsFile=/dev/null", "-i", "~/.ssh/id_rsa.darklab"]
}

module "caddy" {
  source = "./infra/tf/modules/docker_stack/caddy"
}

data "external" "secrets" {
  program = ["pass", "personal/terraform/grafana"]
}

module "monitoring" {
  // Relevant for part 1 article setup and logging
  source = "./infra/tf/modules/docker_stack/monitoring"
  # optionally we can lock ourselves which code to use from external git repo via git source.
  # source = "git@github.com:darklab8/infra.git//tf/modules/docker_stack/monitoring?ref=28407027ebdaba2b48816b63f627c18acd521f46"
  docker_network_caddy_id = module.caddy.network_id
  grafana_password        = data.external.secrets.result["grafana_password"]
  grafana_domain          = "homelab.dd84ai.com"
  logging = {
    enabled = true
  }

  // Relevant for part 2 article
  tracing = {
    enabled = true
  }
  // Relevant for part 3 article
  metrics = {
    enabled = true
  }
  // Relevant for part 4 article
  alerts = {
    enabled             = true
    discord_webhook_url = data.external.secrets.result["discord_webhook_url"]
  }
}

locals {
  grafana_password = data.external.secrets.result["grafana_password"]
  grafana_creds    = "admin:${local.grafana_password}"
}


provider "grafana" {
  url  = "https://demo.dd84ai.com/"
  auth = local.grafana_creds
}

// Data sources for all article parts at the same time
module "datasources" {
  # source = "./datasources"
  source = "./infra/tf/modules/grafana_stack/datasources"
  # optionally we can lock ourselves which code to use from external git repo via git source.
  # source = "git@github.com:darklab8/infra.git//tf/modules/grafana_stack/datasources?ref=27d0889348b1b526234d6db7ff60cf2793a772ca"
}
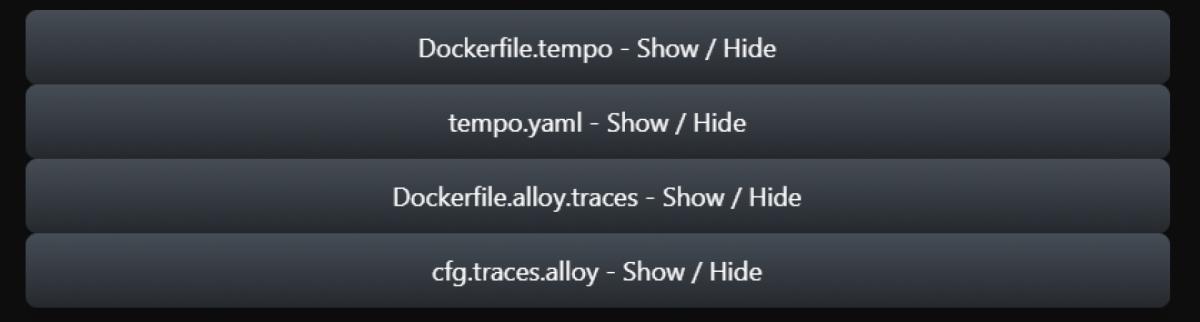
Participating configs:
Proceed to apply deployment for raising the tracing stack part (or use Opentofu(Terraform) to raise all stuff together as modules from ./main.tf):
git clone --recurse-submodules https://github.com/darklab8/blog
cd blog/articles/article_detailed/article_20250609_grafana/code_examples

export DOCKER_HOST=ssh://root@homelab
docker ps

# ONLY if you did not do things from first article part about Loki and follow docker-compose path:
docker compose up -d caddy # we need it for reverse proxy and automated TLS certs
docker compose up -d grafana # visualizer where we query traces. Already yaml of provisioned datasources and installed plugin for tracing drilldown interface

# Continue with Tracing article content:
# if docker-compose way:
docker compose -f docker-compose.tracing.yaml build
docker compose -f docker-compose.tracing.yaml up -d tempo # tracing backend
docker compose -f docker-compose.tracing.yaml up -d alloy-traces # agent collector of traces to which we can send them over network

# if opentofu way
tofu init
tofu apply

# after deploy, u need to grant tempo proper rights to be persistent and possible to init
chmod -R a+rw /var/lib/docker/volumes/tempo_data
chmod -R a+rw /var/lib/docker/volumes/grafana_data # just in case grant grafana rights too if not granted
Demo application for testing
export DOCKER_HOST=ssh://root@homelab
docker compose -f docker-compose.app-traces.yaml build
docker compose -f docker-compose.app-traces.yaml run -it app-traces-go
With the following code deployed:
package main

import (
	"context"
	"errors"
	"fmt"
	"math/rand/v2"
	"time"

	"github.com/darklab8/go-typelog/otlp"
	"github.com/darklab8/go-utils/typelog"
	"go.opentelemetry.io/otel"
)

type WebEndpoint struct {
	pattern      string
	max_duration float64
	url          func() string
}

var WebEndpoints = []WebEndpoint{
	{
		pattern:      "/index.html",
		max_duration: 0.1,
		url:          func() string { return "/index.html" },
	},
	{
		pattern:      "/some_pattern1",
		max_duration: 1,
		url:          func() string { return "/some_pattern1" },
	},
	{
		pattern:      "/another_pattern",
		max_duration: 2,
		url:          func() string { return "/another_pattern" },
	},
	{
		pattern:      "/books/__book_id__",
		max_duration: 0.1,
		url:          func() string { return fmt.Sprintf("books/%d", rand.IntN(100)) },
	},
	{
		pattern:      "/books/__book_id__/page/__page_id__",
		max_duration: 0.2,
		url:          func() string { return fmt.Sprintf("books/%d/page/%d", rand.IntN(100), rand.IntN(1000)) },
	},
}

var (
	logger *typelog.Logger = typelog.NewLogger("go-demo-app")
	Tracer                 = otel.Tracer("go-demo-app")
)

func NestedAction(ctx_span context.Context) {
	ctx_span, span := Tracer.Start(ctx_span, "nested action")
	defer span.End()
}

func doRun() {
	time_start := time.Now()
	fmt.Println("started run", time_start)
	ctx_span, span := Tracer.Start(context.Background(), "web request")
	defer span.End()

	time.Sleep(3 * time.Second)

	web_endpoint := WebEndpoints[rand.IntN(len(WebEndpoints))]
	duration := rand.Float64() * web_endpoint.max_duration
	pattern := web_endpoint.pattern
	logger.InfoCtx(ctx_span, "web request",
		typelog.String("url_pattern", pattern),
		typelog.Float64("duration", duration),
		typelog.String("url_path", web_endpoint.url()),
	)
	NestedAction(ctx_span)
	fmt.Println("fninished run", time.Now(), time.Since(time_start))
	time.Sleep(3 * time.Second)
}

func main() {
	fmt.Println("starting app-traces")
	ctx := context.Background()
	otelShutdown, err := otlp.SetupOTelSDK(ctx) // Set up OpenTelemetry.
	if err != nil {
		fmt.Println("error to initialize tracing, err=", err.Error())
	}
	defer func() { // Handle shutdown properly so nothing leaks.
		err = errors.Join(err, otelShutdown(context.Background()))
	}()
	fmt.Println("configured tracing")
	for {
		doRun()
		time.Sleep(30 * time.Second)
	}
}
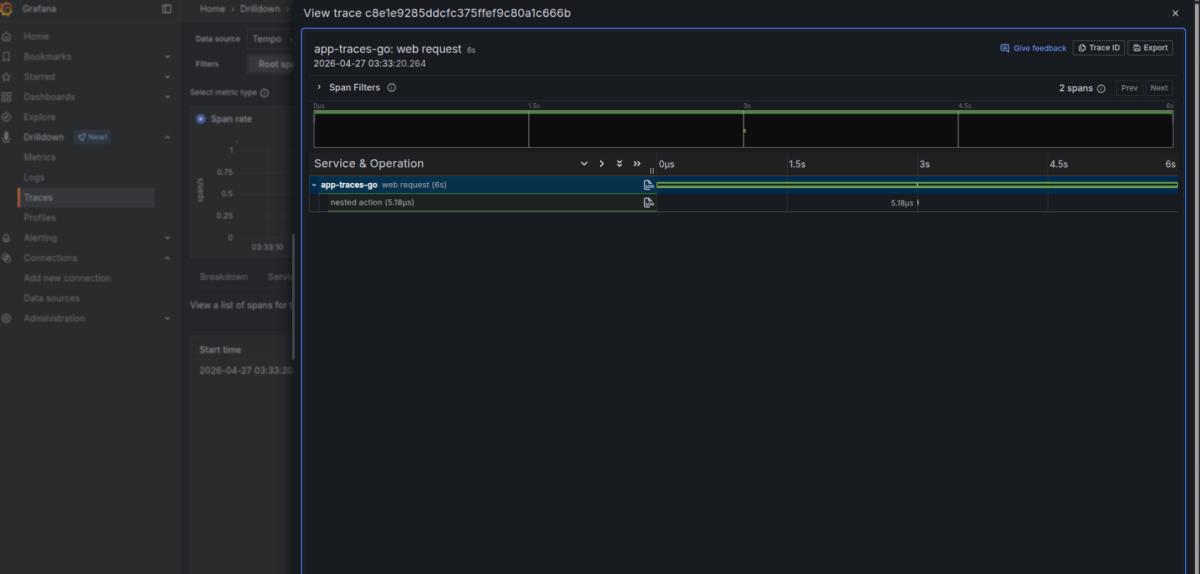
So, as we see in its logging it is working:
> starting app-traces
> configured trading
> started run 2026-04-27 01:33:20.263967654 +0000 UTC m=+0.004603667
> fninished run 2026-04-27 01:33:23.264569558 +0000 UTC m=+3.005205571 3.000601995s
If everything is all right and no errors appear at any level in the chain:
- The app works fine (validate with docker logs app-traces-go).
- Grafana Alloy works fine and has no errors regarding sending traces (validate with docker logs alloy-traces).
- Tempo works fine (validate with docker logs tempo) and has no errors related to issues like being unable to initialize the backend because it does not have sufficient rights to its data folder (to fix this, you need to run chmod -R a+rw /var/lib/docker/volumes/tempo_data/).
- Grafana works fine and initialized itself with provisioning data resources (validate with docker logs grafana).
- The Grafana plugin for tracing drilldown works fine as well (open the tracing drilldown interface in Grafana and see if it has any data).
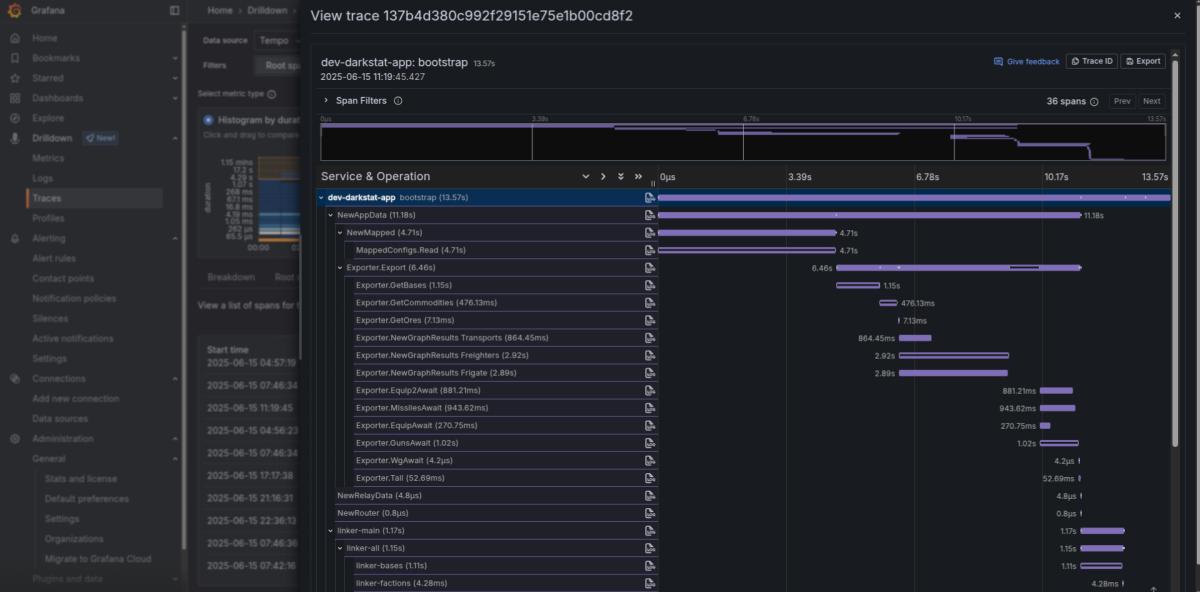
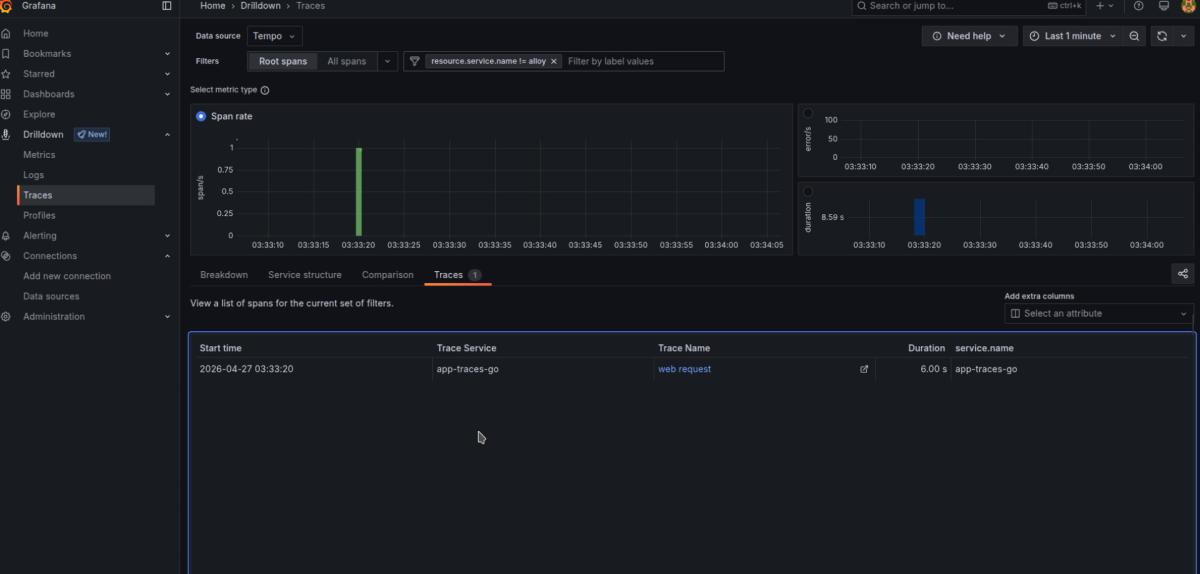
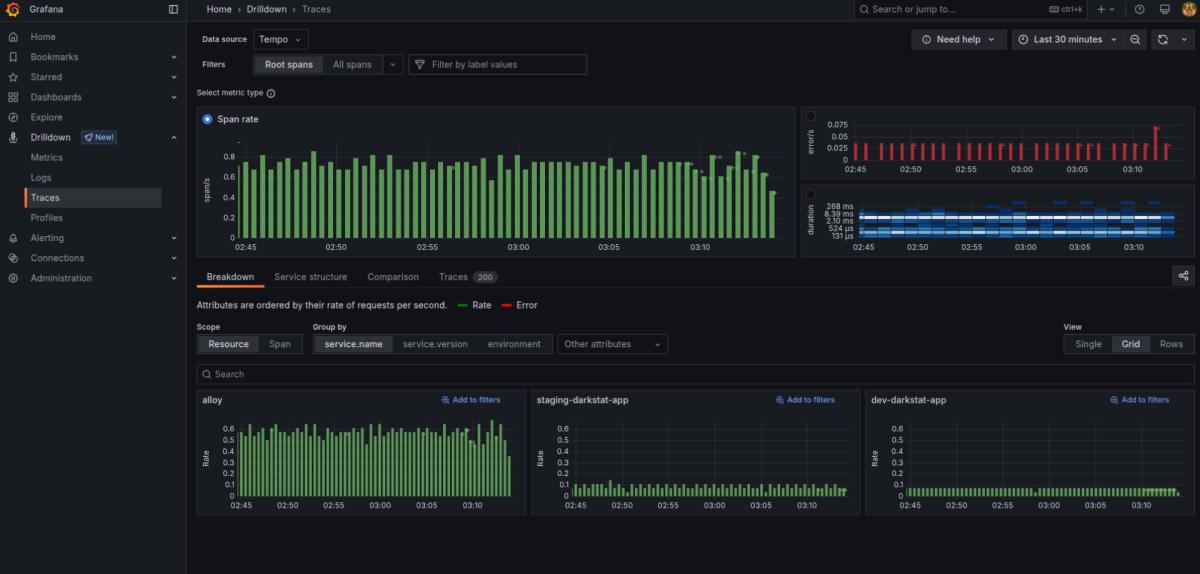
You will then see traces visible in your tracing drilldown interface.
In the real world, tracing is the most useful for backend applications, and it is best to turn it on by default for all network-interacting libraries by writing some kind of middleware. Then, it will be able to show you if the issues you are having are at a specific SQL request, an ElasticSearch query, or a specific HTTP request.
And since it is distributed tracing, the trace will show how the workload works within the called service too (as you can see in the picture below, we have an HTTPS request propagated into Keycloak to show the internals of its authorization)!
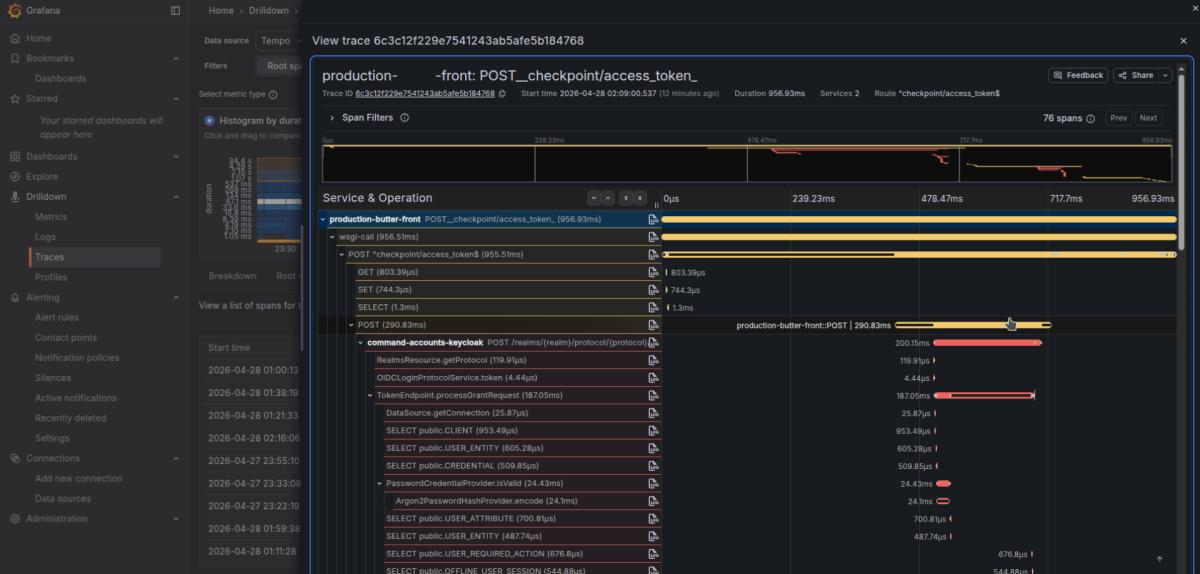
The tracing drilldown interface simplifies navigating through them. By clicking the blue duration graph, you can easily find the slowest traces. Click "errors" to find the errors. You can also input different filters — from service_name to Kubernetes cluster names and namespaces — to filter traces by different locations.
Note
In pet projects, tracing's usability is honestly very limited, since it is very doubtful for a pet project to have any kind of network interaction long enough to require tracing debugging. Your database will rarely reach a level that requires you to debug it this way. You will benefit more from logging and metrics monitoring systems in pet projects. In any real backend work, though, tracing is the most useful system to have. I would dare to say it is potentially even more useful than any other type of monitoring!
Production-grade Configuration Tips
While the Docker Compose setup we used is great for homelabs and pet projects, running Tempo in a high-traffic environment requires a more robust approach. If you are preparing to handle a serious volume of traces in production, keep these deployment and optimization best practices in mind:
- It is common to deploy the horizontally distributed Tempo-distributed Helm chart in a K8s cluster for production-grade Tempo running if you have a serious workload.
- As far as I have tested so far, Minio remains the fastest storage backend for it, which for some reason, works at least 3 times faster than Garage on a large volume of traces (600GB in 2 days at a 10% sampling rate). Regretfully, Minio is deprecated, and some replacement will eventually need to be found.
- You can try different storage options by running instances of Tempo in parallel to find other storage solutions and compare them.
- To make the workload more sane for production, you should utilize a sampling fraction of preferably no more than 10% if you have a serious workload.
- The k8s-monitoring Helm chart remains the most boilerplate-ready way to run it out of the box in Kubernetes. In the rest of the cases (like AWS ECS or a homelab), it is easiest to use its Docker-based deployment.
You’ll find updated versions of these articles and the next parts here.