
Logs — check ✅, traces — check ✅, metrics are next! Andrey, Senior Developer at Noveo, continues his series of posts on monitoring.
Intro
Metrics are the most useful form of monitoring because they tell you roughly when and where an issue is.
- For example, we can see CPU/RAM/disk usage and other general metrics about a running application. This includes when there were potentially reported OOM kills, with a history of data over a period of, let's say, the last month.
- We can also look at detailed breakdowns regarding which of our endpoints were slow and what percentage of them were affected. At which endpoint did the web server spend the most total time (after summing the time of all processed responses)?
- Additionally, we might track where our message queue-handling workers are stuck, where they encounter errors, etc.
Metrics detail the "When" and "What." This historic data gives us an understanding of where the source of the issue is, or the timeframe in which to dig further for data (using logs and traces).
You no longer need to watch the current values of application usage in real time; you are able to monitor historic data and find clues among the noticed patterns!
The most important quality of metrics is that they are highly performant to query and store. They are taken once per minute, for example, per single set of labels (such as application_name, endpoint_name, and status_code). So, while with log monitoring we might struggle to maintain weeks of data retention, and tracing is barely affordable for even a few days of data, we are still able to retain metrics data for many months — even in the most highly loaded infrastructures.
The most common issue. High cardinality
The biggest and most frequent mistake people make is having too many unique label values (high cardinality) in a single metric. This causes a rapid explosion in both RAM usage and storage. You can debug which metric is consuming too much space by using a top-k count query to find the worst offenders.
topk(20, count by (__name__, job)({__name__=~".+"}))
Optionally, if you know a specific label in a metric has a high number of values but you are having trouble identifying which ones, you can output the metric label values grouped by their first N characters. For example, here is how we output span_name in traces_spanmetrics_latency_count, grouped by the first 5 characters.
sum by (span_prefix) (

  label_replace(

    traces_spanmetrics_latency_count,

    "span_prefix",

    "$1",

    "span_name",

    "(.{5}).*"

  )

)
Raising Prometheus
Important
We provide a Docker Compose configuration as a demo example because most developers are familiar and comfortable with it. However, we utilize Terraform for our actual configuration and strongly recommend using it instead of Docker Compose if you can. The book Terraform: Up & Running is an excellent place to start learning it.
#docker-compose.yaml

services:
  prometheus:
    build:
      dockerfile: ./Dockerfile.prometheus
      context: .
    container_name: prometheus
    restart: always
    entrypoint: ["/bin/prometheus"]
    command:
      - --config.file=/etc/prometheus/prometheus.yml
      - --web.enable-remote-write-receiver
      - --enable-feature=exemplar-storage
      - --storage.tsdb.retention.time=30d
      - --storage.tsdb.retention.size=10GB
    networks:
      grafana:
        aliases:
          - prometheus
    volumes:
      - prometheus_data:/prometheus
    ports:
      - "9090:9090"
    mem_limit: 1000m

  alloy-metrics:
    build:
      dockerfile: ./Dockerfile.alloy.metrics
      context: .
    container_name: alloy-metrics
    restart: always
    privileged: true
    entrypoint: ["/bin/alloy"]
    command:
      - run
      - /etc/alloy/config.alloy
      - --storage.path=/var/lib/alloy/data
    logging:
      driver: "json-file"
      options:
        mode: "non-blocking"
        max-buffer-size: "500m"
    networks:
      grafana:
        aliases:
          - alloy-metrics
    volumes:
      - /var/run/docker.sock:/var/run/docker.sock:ro
      - /cgroup:/cgroup:ro
      - /:/rootfs:ro
      - /proc:/host/proc:ro
      - /sys:/sys:ro
      - /var/run:/var/run:rw
      - /dev/disk:/dev/disk:ro
      - /etc:/host/etc:ro
    mem_limit: 1000m

networks:
  grafana:
    external: true

volumes:
  prometheus_data:
    name: prometheus_data
#main.tf

# Option to raise as Terraform
terraform {
  required_providers {
    docker = {
      source  = "kreuzwerker/docker"
      version = ">=3.0.2"
    }
    grafana = {
      source = "grafana/grafana"
    }
  }
}

provider "docker" {
  host     = "ssh://homelab"
  ssh_opts = ["-o", "StrictHostKeyChecking=no", "-o", "UserKnownHostsFile=/dev/null", "-i", "~/.ssh/id_rsa.darklab"]
}

module "caddy" {
  source = "./infra/tf/modules/docker_stack/caddy"
}

data "external" "secrets" {
  program = ["pass", "personal/terraform/grafana"]
}

module "monitoring" {
  // Relevant for part 1 article setup and logging
  source = "./infra/tf/modules/docker_stack/monitoring"
  # optionally we can lock ourselves which code to use from external git repo via git source.
  # source = "git@github.com:darklab8/infra.git//tf/modules/docker_stack/monitoring?ref=28407027ebdaba2b48816b63f627c18acd521f46"
  docker_network_caddy_id = module.caddy.network_id
  grafana_password        = data.external.secrets.result["grafana_password"]
  grafana_domain          = "homelab.dd84ai.com"
  logging = {
    enabled = true
  }

  // Relevant for part 2 article
  tracing = {
    enabled = true
  }
  // Relevant for part 3 article
  metrics = {
    enabled = true
  }
  // Relevant for part 4 article
  alerts = {
    enabled             = true
    discord_webhook_url = data.external.secrets.result["discord_webhook_url"]
  }
}

locals {
  grafana_password = data.external.secrets.result["grafana_password"]
  grafana_creds    = "admin:${local.grafana_password}"
}


provider "grafana" {
  url  = "https://demo.dd84ai.com/"
  auth = local.grafana_creds
}

// Data sources for all article parts at the same time
module "datasources" {
  # source = "./datasources"
  source = "./infra/tf/modules/grafana_stack/datasources"
  # optionally we can lock ourselves which code to use from external git repo via git source.
  # source = "git@github.com:darklab8/infra.git//tf/modules/grafana_stack/datasources?ref=27d0889348b1b526234d6db7ff60cf2793a772ca"
}
Participating configs:
prometheus.yaml

global:
  scrape_interval: 1m


alerting:
  alertmanagers:
    - scheme: http
      static_configs:
        - targets: [ 'alertmanager:9093' ]
cfg.metrics.alloy

prometheus.exporter.cadvisor "docker_metrics" {
  docker_host = "unix:///var/run/docker.sock"
  storage_duration = "5m"
  store_container_labels = true
  env_metadata_allowlist = [
    "VERSION_ID",
  ]
  enabled_metrics = [
    // default
    "cpu", "sched", "percpu", "memory", "cpuLoad", "diskIO", "disk",
    "network", "app", "process", "perf_event", "oom_event",
    // not default
    "process",
    // DO NOT TURN ON advtcp. it has highly cardinal `container_network_advance_tcp_stats_total`. Or exclude this one before turning on.
    // "memory_numa", "tcp", "udp", "advtcp", "hugetlb", "referenced_memory", "cpu_topology", "resctrl", "cpuset
  ]
}

// Configure a prometheus.scrape component to collect cadvisor metrics.
prometheus.scrape "scraper" {
  targets    = prometheus.exporter.cadvisor.docker_metrics.targets
  forward_to = [ prometheus.relabel.labelator.receiver ]
}

prometheus.relabel "labelator" {
  forward_to = [prometheus.remote_write.backend.receiver]

  rule {
    source_labels = ["__meta_docker_container_name"]
    regex = "/(.*)"
    action = "replace"
    target_label = "container_name"
  }
}

prometheus.relabel "host_metrics" {
  forward_to = [prometheus.remote_write.backend.receiver]
  rule {
      target_label = "instance"
      replacement = string.trim_space(local.file.hostname.content)
  }
}

local.file "hostname" {
  filename  = "/host/etc/hostname"
}

prometheus.remote_write "backend" {
  endpoint {
    url = coalesce(sys.env("PROMETHEUS_URL"),"http://prometheus:9090/api/v1/write")
  }
}

// Add also Unix exporter
// https://grafana.com/docs/alloy/latest/reference/components/prometheus/prometheus.exporter.unix/
// https://grafana.com/docs/grafana-cloud/send-data/metrics/metrics-prometheus/prometheus-config-examples/docker-compose-linux/

prometheus.exporter.unix "hosts" {
    procfs_path	= "/host/proc"  // /proc default
    sysfs_path	= "/sys"   // string	The sysfs mount point.	/sys	no
    rootfs_path	= "/rootfs"     // string	Specify a prefix for accessing the host filesystem.	/	no
    filesystem {
        mount_points_exclude = "^/(sys|proc|dev|host)($$|/)"
    }
}

// Configure a prometheus.scrape component to collect unix metrics.
prometheus.scrape "hosts" {
  targets    = prometheus.exporter.unix.hosts.targets
  forward_to = [prometheus.relabel.host_metrics.receiver]
}

discovery.docker "prometheus_endpoints" {
  host = "unix:///var/run/docker.sock"
  match_first_network = false
  filter {
    name = "label"
    values = ["prometheus"]
  }
}

prometheus.scrape "prometheus_endpoints" {
  targets    = discovery.docker.prometheus_endpoints.targets
  forward_to = [prometheus.relabel.labelator.receiver]
  scrape_interval = "60s"
}

discovery.dockerswarm "prometheus_endpoints_swarm" {
  host = "unix:///var/run/docker.sock"
  role = "tasks"
  filter {
    name = "label"
    values = ["prometheus"]
  }
}

prometheus.scrape "prometheus_endpoints_swarm" {
  targets    = discovery.dockerswarm.prometheus_endpoints_swarm.targets
  forward_to = [prometheus.relabel.labelator.receiver]
  scrape_interval = "60s"
}
Dockerfile.prometheus

FROM prom/prometheus:v3.2.1
COPY infra/tf/modules/docker_stack/monitoring/prometheus.yaml /etc/prometheus/prometheus.yml
Dockerfile.metrics.traces

FROM grafana/alloy:v1.8.3
COPY infra/tf/modules/docker_stack/monitoring/cfg.metrics.alloy /etc/alloy/config.alloy
Proceed to apply the deployment to spin up the metrics stack components (or use OpenTofu/Terraform to deploy everything together as modules from ./main.tf).
git clone --recurse-submodules https://github.com/darklab8/blog
cd blog/articles/article_detailed/article_20250609_grafana/code_examples

export DOCKER_HOST=ssh://root@demo
docker ps

# ONLY if you did not do things from previous article part about Loki or Tempo follow docker-compose path:
docker compose up -d caddy # we need it for reverse proxy and automated TLS certs
docker compose up -d grafana # visualizer where we query traces. Already yaml of provisioned datasources configured

# Continue with Prometheus article content:
# if docker-compose way:
docker compose -f docker-compose.prometheus.yaml build
docker compose -f docker-compose.prometheus.yaml up -d prometheus
docker compose -f docker-compose.prometheus.yaml up -d alloy-metrics

# if opentofu way
tofu init
tofu apply

# after deploy, you need just in case to grant prometheus proper rights to be persistent and possible to init
chmod -R a+rw /var/lib/docker/volumes/prometheus_data
chmod -R a+rw /var/lib/docker/volumes/grafana_data # just in case grant grafana rights too if not granted
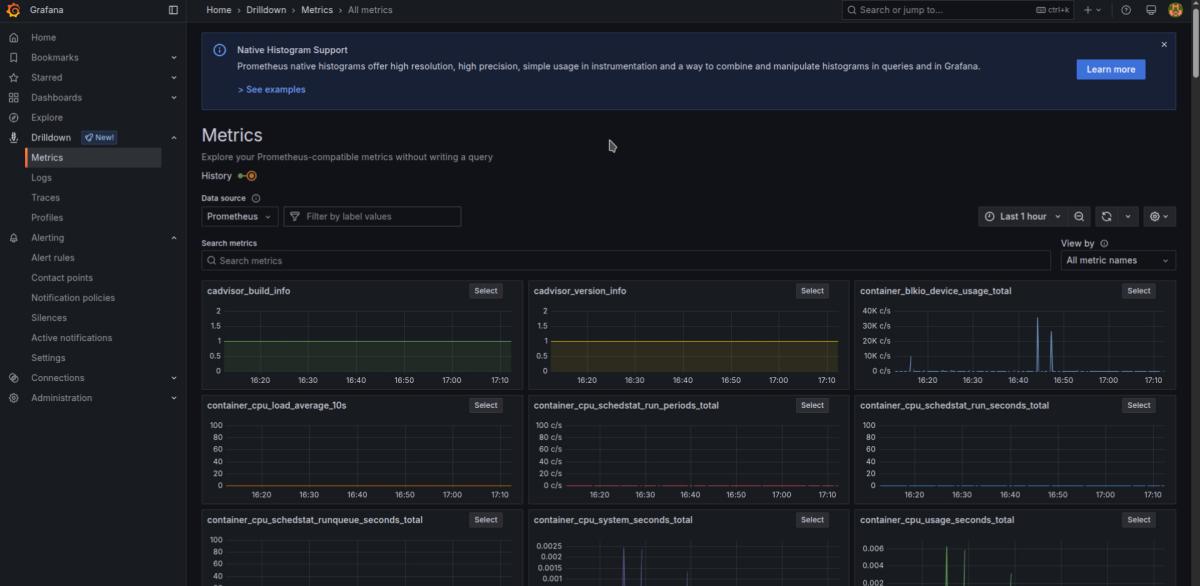
If everything was configured correctly, you should now be able to open the Metrics Drilldown page and see incoming metrics. This article provides an Alloy configuration with pre-written Docker monitoring, as it is the most comfortable and minimalist approach for deployment in a homelab server.
Note
If you wish monitoring by metrics something else besides docker and applications in docker, for example postgres, elasticsearch, aws cloudwatch and etc. Check other grafana alloy components for other provided prometheus integrations.
Infrastructure Dashboards
If you want to monitor anything besides Docker and containerized applications — such as PostgreSQL, Elasticsearch, AWS CloudWatch, etc. — check the official Grafana Alloy components for other Prometheus integrations.
- Cadvisor alloy component for Docker metrics
- Unix alloy component for node exporter metrics accordingly
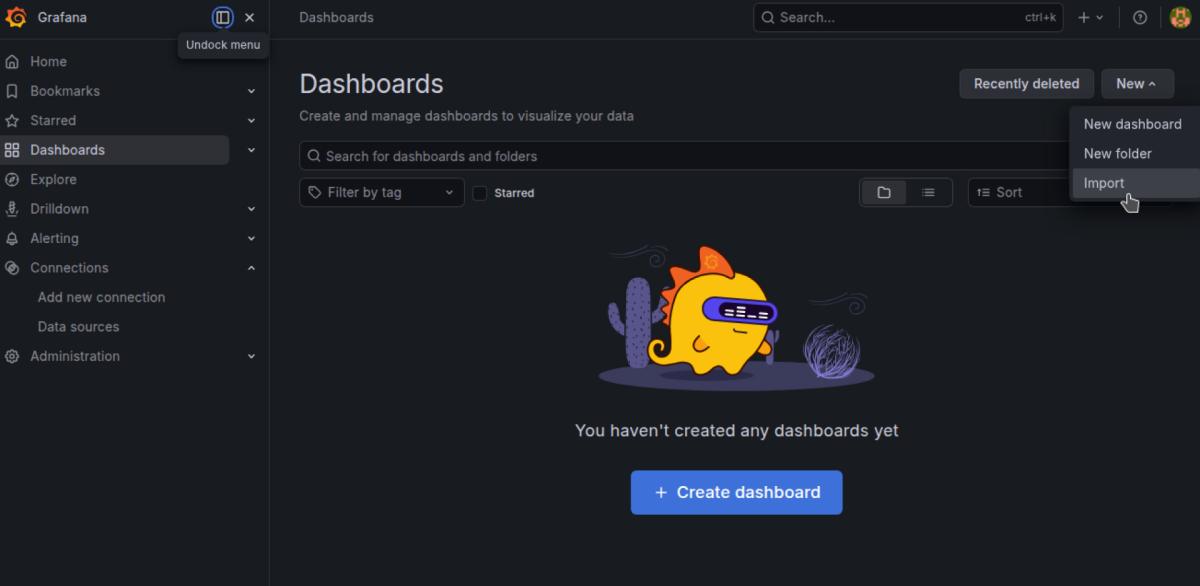
Import dashboards for Docker and Unix
- Node Exporter dashboard JSON (import from the original source).
- Import from original source.
- cAdvisor / Docker monitoring dashboard JSON.
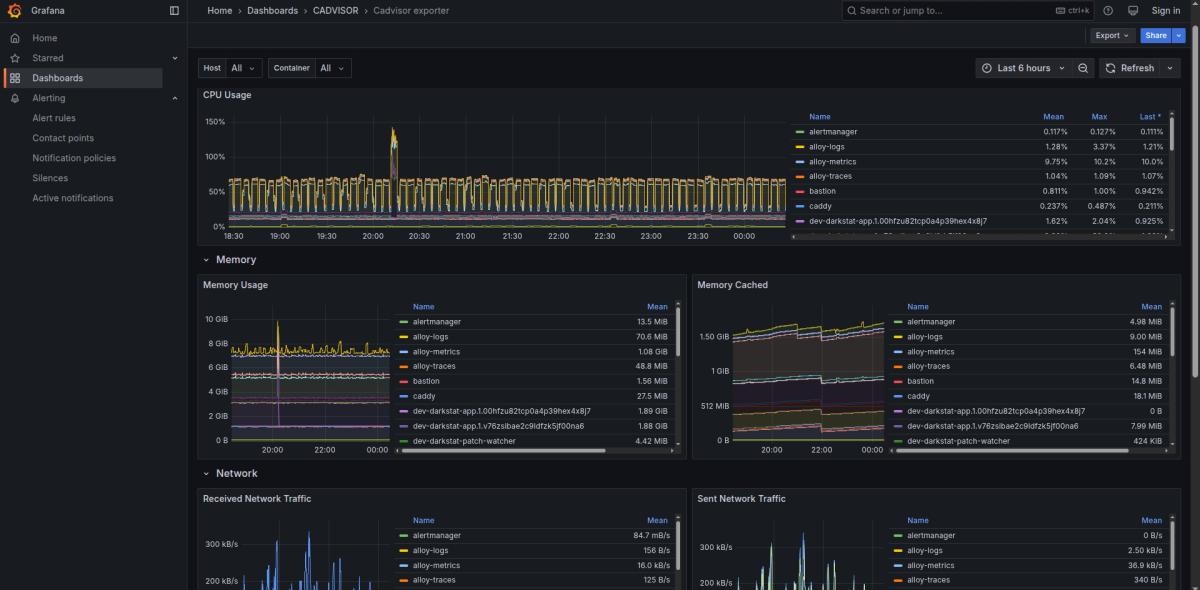
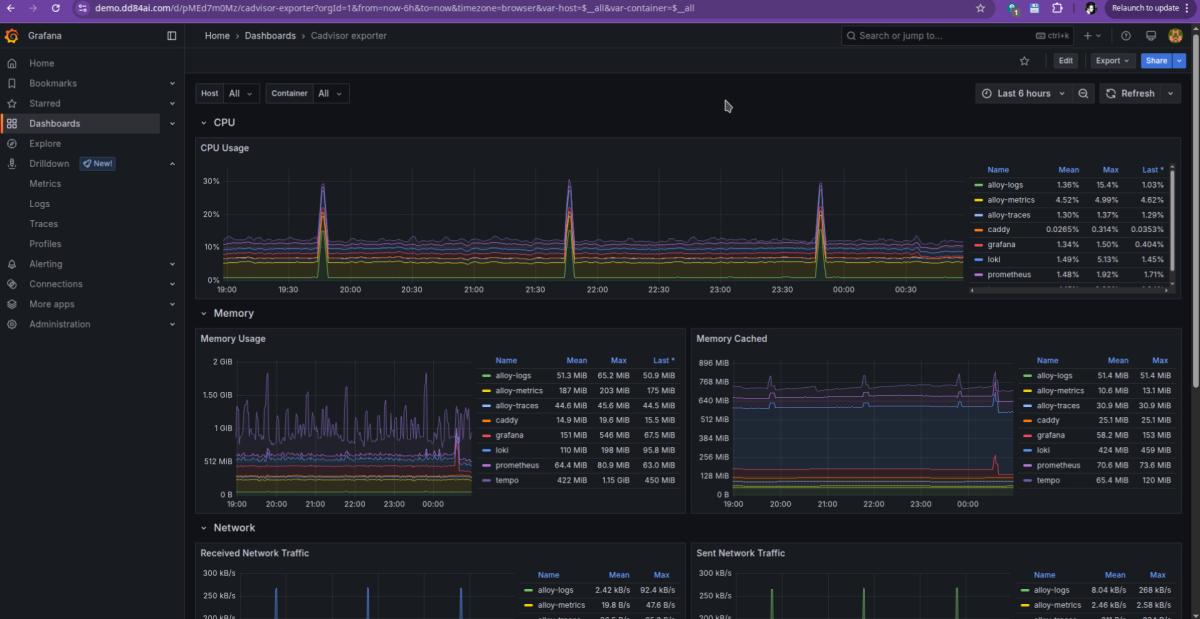
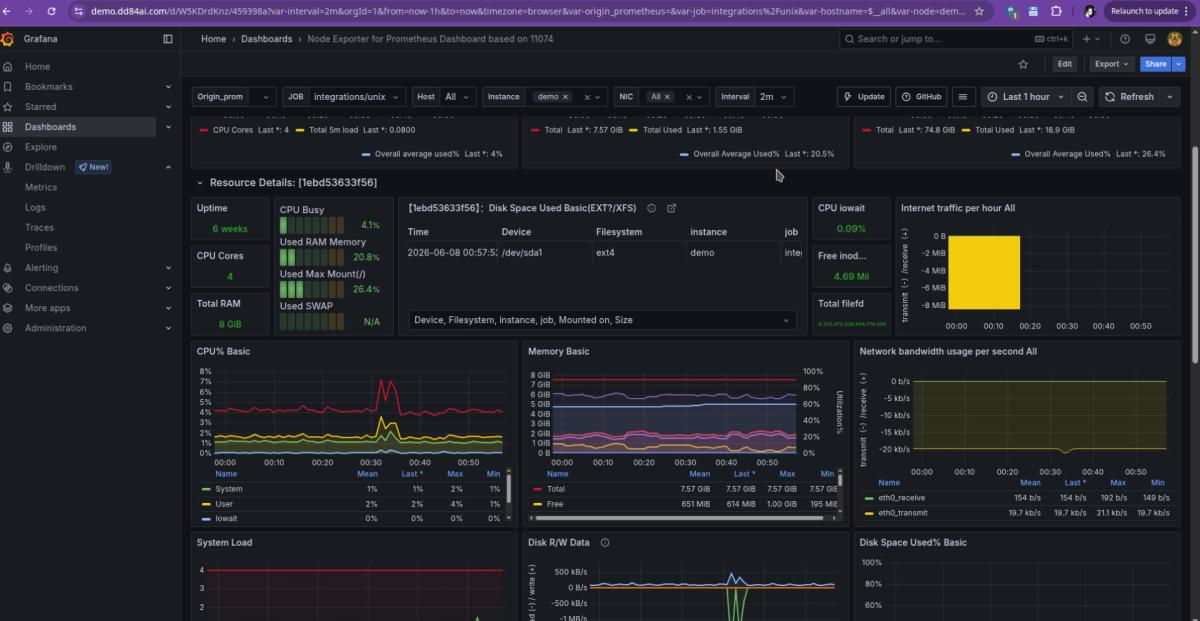
If you imported everything correctly, and your Grafana image version is 11.6 (as supported by these dashboards and specified in the docker-compose), you will now see metrics for your containers and Linux server accordingly.
cAdvisor dashboard (about Docker containers):
Node exporter dashboard (about linux server):
Caution: if you are still not seeing the dashboards properly, check which Grafana version you are using. We can confirm it works fine with at least version 11.6.
Note
The author of this article handles the Grafana side of configurations using the Terraform Grafana provider instead of manual actions: https://github.com/darklab8/infra/tree/master/tf/grafana.
If you want other kinds of Grafana dashboards, you can browse all the community-released options here: https://grafana.com/grafana/dashboards/ , or you can build your own.
Caution: If the imported dashboards are missing data in some of their graphs, make sure your Prometheus data source has its timeInterval set to 60s (which matches the Alloy scraping interval). If you spun up the Grafana web interface using the files from this article, you will have this set automatically, as it is already written into the data source provisioning config.
Application Dashboards
Now that we have the main infrastructure dashboards handled, we need to try having some custom application metrics scraped and displayed on their own dashboard.
- Supported languages for Prometheus libraries can be found here: https://prometheus.io/docs/instrumenting/clientlibs/
- Depending on the language, framework, or infrastructure element, there might already be existing integrations or exporters for it, which you can find here: https://prometheus.io/docs/instrumenting/exporters/. For example, there are even Python Django and PostgreSQL integrations available.
- As mentioned before, the Grafana Alloy scraping agent offers plenty of common exporters that you can choose to use to get access to more metrics: https://grafana.com/docs/alloy/latest/reference/components/prometheus/. To use them properly, you will highly likely need to read their actual underlying repositories to learn about the necessary extra volumes or settings that you need to pass to Grafana Alloy to make it work, depending on what you use.
Read thoroughly through the metric types available here: https://prometheus.io/docs/concepts/metric_types/ to understand how to write your own Prometheus metrics. Roughly, we can say:
- A Counter is good for things like request counts, action counts, and any kind of tracking most of the time. A Counter is ideal when we can simply "ADD" yet another counted occurrence of something.
- A Gauge is for when we need to know the "temperature value" of something — such as how many workers we currently have, or how many active users there are currently (if we have access to active sessions). Additionally, a Gauge is useful for summing up anything. A Gauge is used when it is appropriate to "SET" the value of something.
- A Histogram is used when we need to capture the performance of a request duration, or any other kind of duration across different "route patterns."
I integrated my pet project with the Go library for Prometheus (https://github.com/prometheus/client_golang), added metrics, and registered them in an explicit way to have the ability to add global labels (https://github.com/darklab8/fl-darkstat/blob/master/darkcore/metrics/metrics.go).
Based on that, I have a detailed performance evaluation dashboard for the project "darkstat": https://grafana.dd84ai.com/d/belbdnu2uqe4gd/app-darkstat?var-interval=2m&orgId=1&from=now-3h&to=now&timezone=browser&var-environment=production
- Since it is a web application, I made sure to capture the regular metrics, such as the success and failure rates, as well as the duration of responses that my web server makes.
- I have had plenty of problems with uptime in the past, so I made sure that I have an uptime dashboard present and working through a regular Counter.
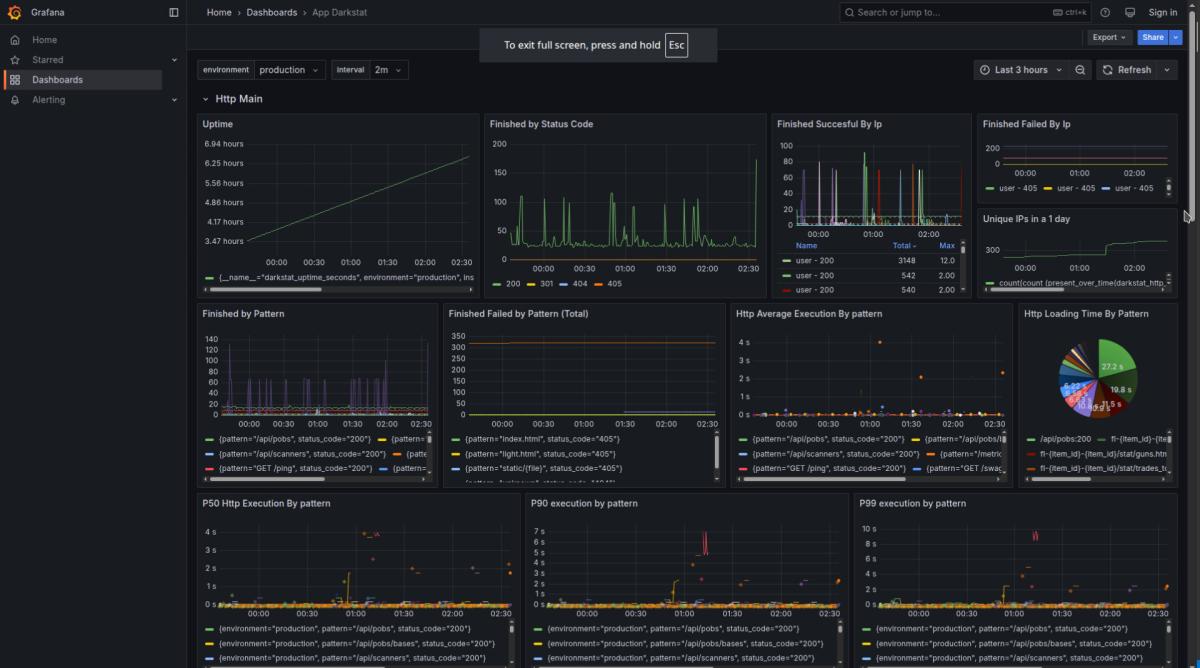
- I took extra notice of worst-case scenarios: when do the worst 50%, 25%, and 10% of responses happen? (P50, P75, and P90 metrics).
- I took notice of which pages have a large body size and create large network traffic for me. Due to the nature of the application, it was important for me to look for this metric.
- I took notice of which path patterns take the most time to load, to mark them as potential targets for optimization.
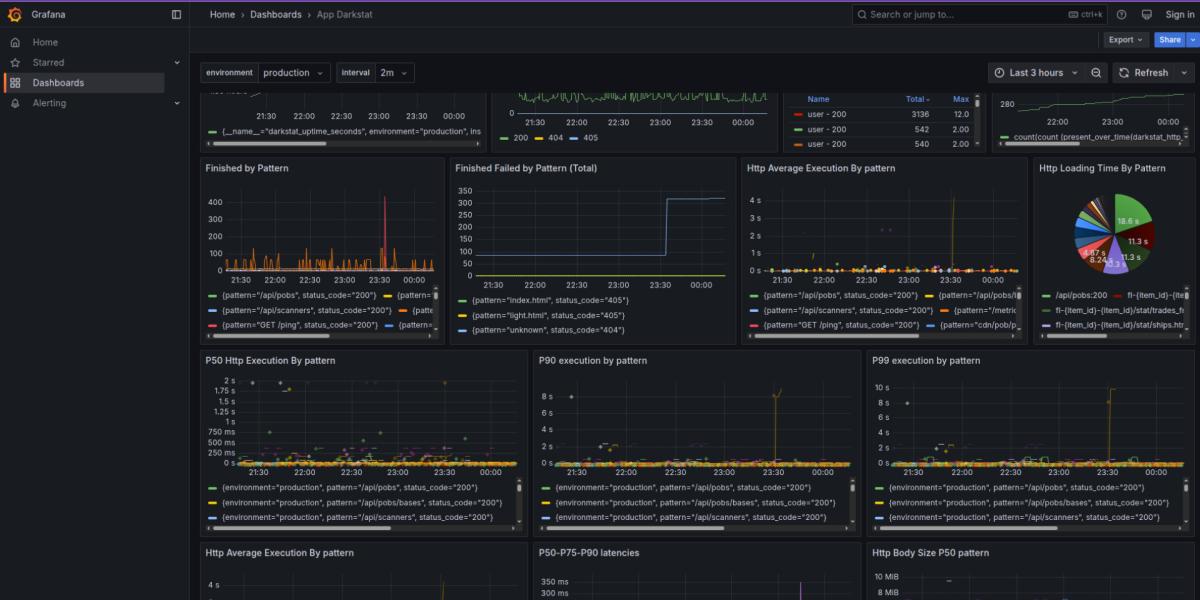
- Lastly, I keep the application's public API running, so out of curiosity, I watch which endpoints are actually in use, and with which user agents, to evaluate the number of users.
- That information gives me insight into what is NOT in use, and I could consider evaluating those endpoints to be removed as not necessary.
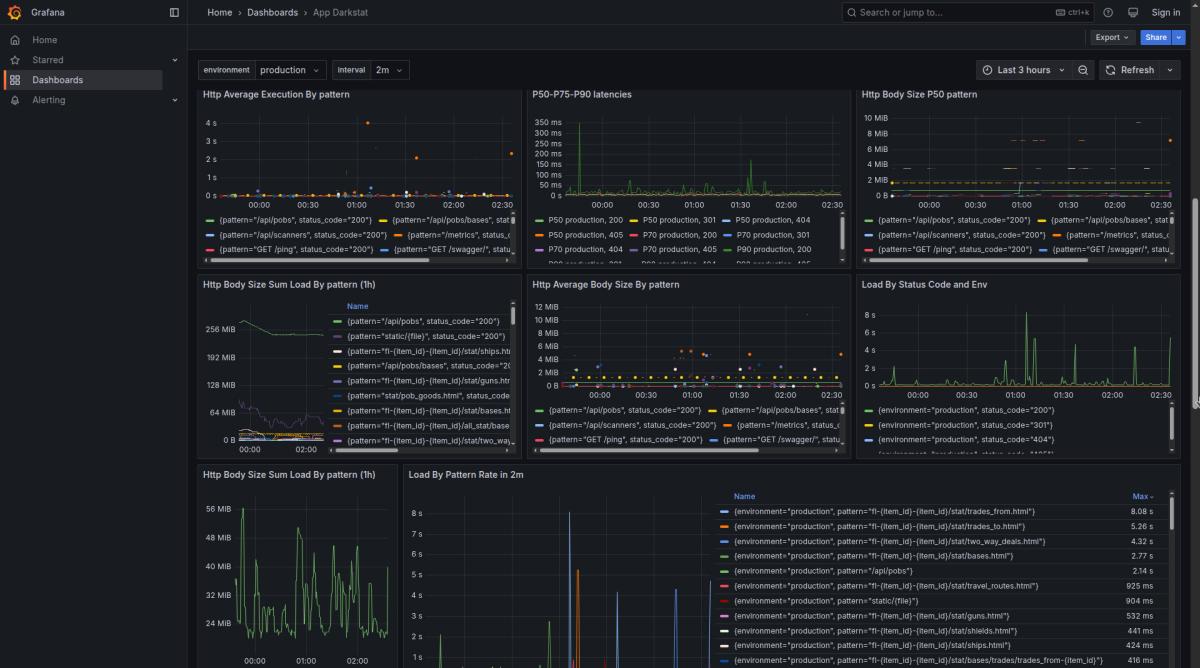
You can find the code for this application dashboard at this link.
What Do We Capture in Application Dashboards?
We use metrics to capture the most critical components that we need to monitor. Specifically, we track:
- How responses are delivered by the web server.
- How interactions with databases function from within the application.
- How requests to external or third-party applications behave.
- How payments are being processed.
- How message queue workers are operating.
- How databases are running and behaving, including how they handle system pressure, RAM, and disk usage.
The primary role of dashboard metrics is to tell us where the issues are happening in the system. They do not necessarily need to tell us exactly how or why those issues are occurring; for that level of deep debugging, we rely on traces, logs, and profiles to gather more information. Furthermore, because of their high performance and efficiency, metrics are the absolute best data source to utilize for triggering system alerts.
Dashboards based on logs and traces
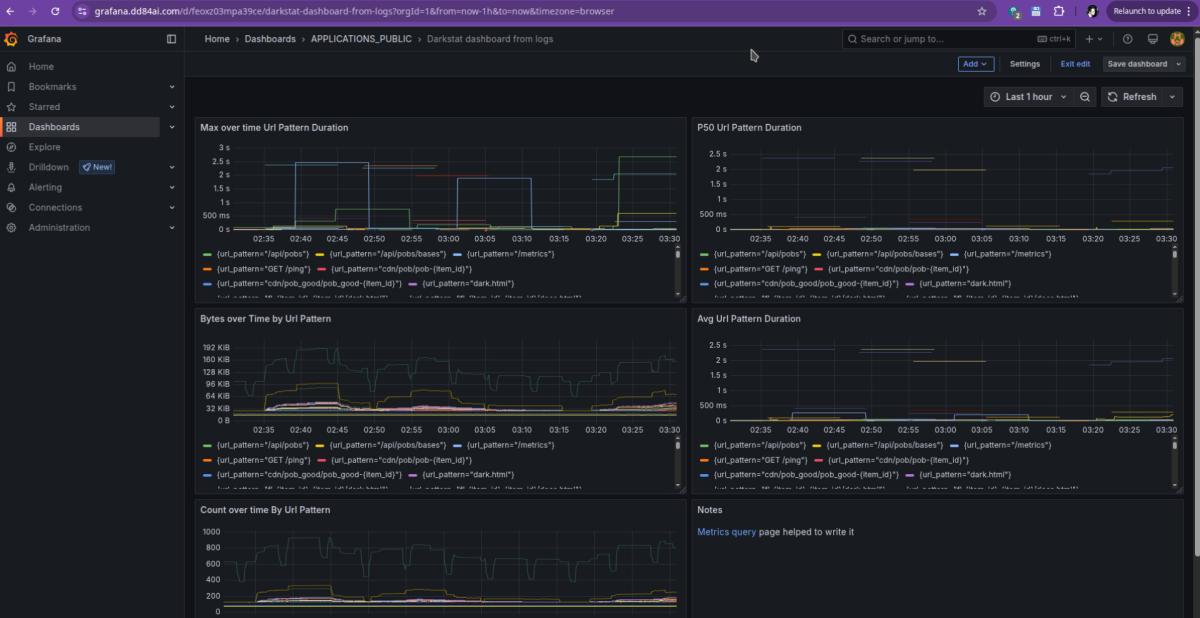
If we have not mentioned it before, we can even make dashboards from logs. However, they will not be as performant for querying, and their usability is limited to applications with a low logging volume. It is much easier to handle Prometheus metrics that are emitted a few times per minute than applications with thousands of log lines per minute.
An example of a dashboard based on logs can be found here, and its code is here.
Dashboard from logs:
What about the dashboards based on traces? We can make a generic dashboard that works based on metrics generated from traces, as shown here; and the code is here.
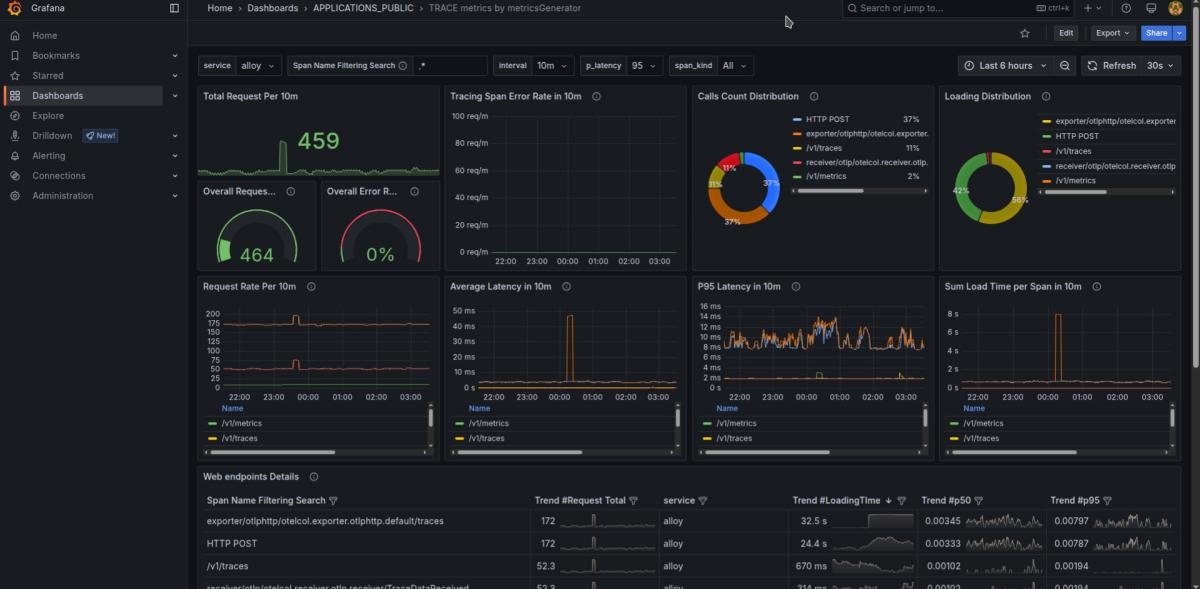
You may find it interesting because you get an auto-generated dashboard simply because your application is connected to tracing. It does have strong limitations, however, such as requiring low-cardinality tracing span names. If a specific application breaks this rule, it needs to be excluded from using the metrics generator.
Caution: Turn off the metrics generator if you do not need the trace APM dashboard; this will save you potentially a lot of RAM usage.
Additionally, dashboard graphs can even be generated from TraceQL metrics, which can be useful in tricky tracing searches. They are not useful for average, everyday usage, however, because the performance demand is too high. Only metrics-based dashboards are performance-efficient enough to be navigated extensively.
Articles updates
All the articles about monitoring configurations — including those about Prometheus metrics — are actively in use, at least in the author's homelab, through Terraform configuration. If you have any doubts, if something has gotten outdated, if something is no longer working, and so on, please refer to the Terraform code there as the single source of truth. There is a good chance the article content will be updated in its repository and redeployed to GitHub Pages with fresh fixes.
Production-grade configuration tips
While Prometheus is perfectly fine for a few hosts in a homelab or a very small production environment:
- I can highly endorse deploying Mimir if you have a serious production environment in a horizontally scaled infrastructure like Kubernetes (https://github.com/grafana/mimir/tree/main/operations/helm/charts/mimir-distributed). The main advantage of Mimir is that it is actually horizontally scalable and able to withstand higher workloads simply because it can distribute the RAM workload across its scaled instances.
- In turn, the Kubernetes monitoring Helm chart is perfect for scraping metrics from Kubernetes. Grafana Alloy is perfect for usage in Kubernetes, in Dockerized deployments, in AWS ECS, or even for deployment to Linux servers that have everything running through systemd. It can work anywhere and scrape everything.
- To make Mimir work at full power, you will want to learn how to configure Mimir Rules. That will unlock your ability to have detailed, fully functional dashboards of any kind in Mimir, provided you simply import the same Prometheus Rules that are provided for those specific dashboards. This can be handled by the Terraform Mimir provider.
- Some people choose VictoriaMetrics as an alternative. It may be a good alternative, but the author of this article has not tested it on a workload comparable to Mimir to be certain which choice works better. Since there are no serious complaints about Mimir, and it works perfectly fine and scales well, there has not yet been a need for the author to switch to VictoriaMetrics.
- Nevertheless the migration to the Victoria Metrics became already planned, based on more recently acquired data of using Victoria Logs and Victoria Tracing (5-10 times less RAM usage, CPU and Disk usage than its counterparts Loki and Tempo). The author trusts Victoria Metrics to bring a similar big win in performance.
I hope this deep dive into metrics and dashboards gives you a solid foundation for your own infrastructure. Good luck with your deployments, and happy monitoring!
You’ll find updated versions of these articles and the next parts here.
