Many, if not all, things in life are oftentimes determined by a combination of tiny (and otherwise insignificant) details – and it’s the same with businesses too. There’s nothing sadder than seeing a small promising coffee shop get close to no attention just because it’s located one intersection “too far” from the office district so workers decide to rather visit someplace nearer during their lunch break. “One cannot foresee everything,” sigh the philosophers. “So let’s at least foresee what can be foreseen!” proclaims our customer, refusing to take no action.
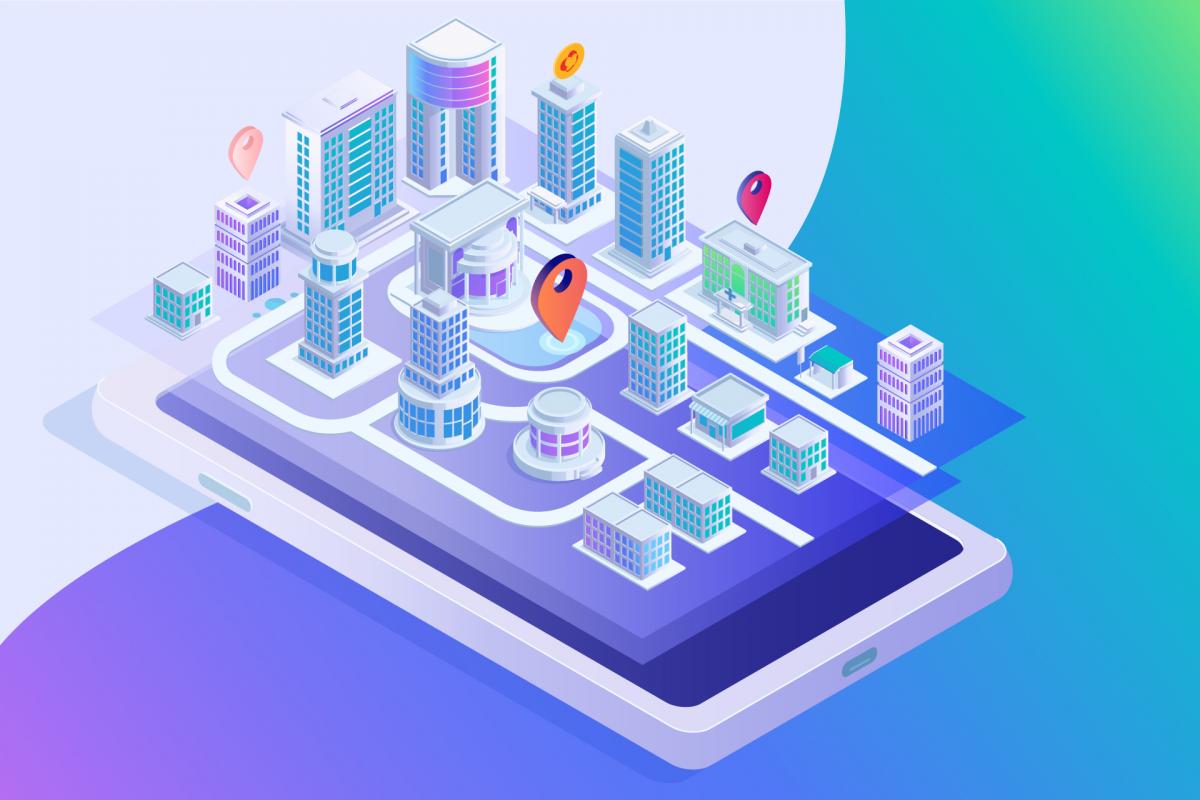
Why not turn our attention to the information that is already available and try to look at it all from a different perspective? This simple question was the starting point for a project that, after many days of trial and error, resulted in a powerful and easy-to-use tool: a web application that uses geolocation data in order to analyse the movements of people and vehicles.
In fact, thorough research of geodata gathered over a couple of years can give you a pretty good insight into a number of things:
- you can define the liveliest and the quietest areas of a city (or, let’s say, a mall or an amusement park),
- find out how many steps people make every day while walking down a certain street,
- analyse the “heaviness” and direction of traffic (cars and pedestrians included) depending on the hour –
to name just a few. So now, thanks to the customer’s service, business owners can get access to all the necessary information for locating the best spot for their next office, developing a suitable growth strategy, and anticipating any market shifts. The potential of such a solution has already been recognised by real estate agencies, retailers, catering and banking organisations – not to mention some of the government institutions, who’ve introduced the solution into their workflow along with many other users.
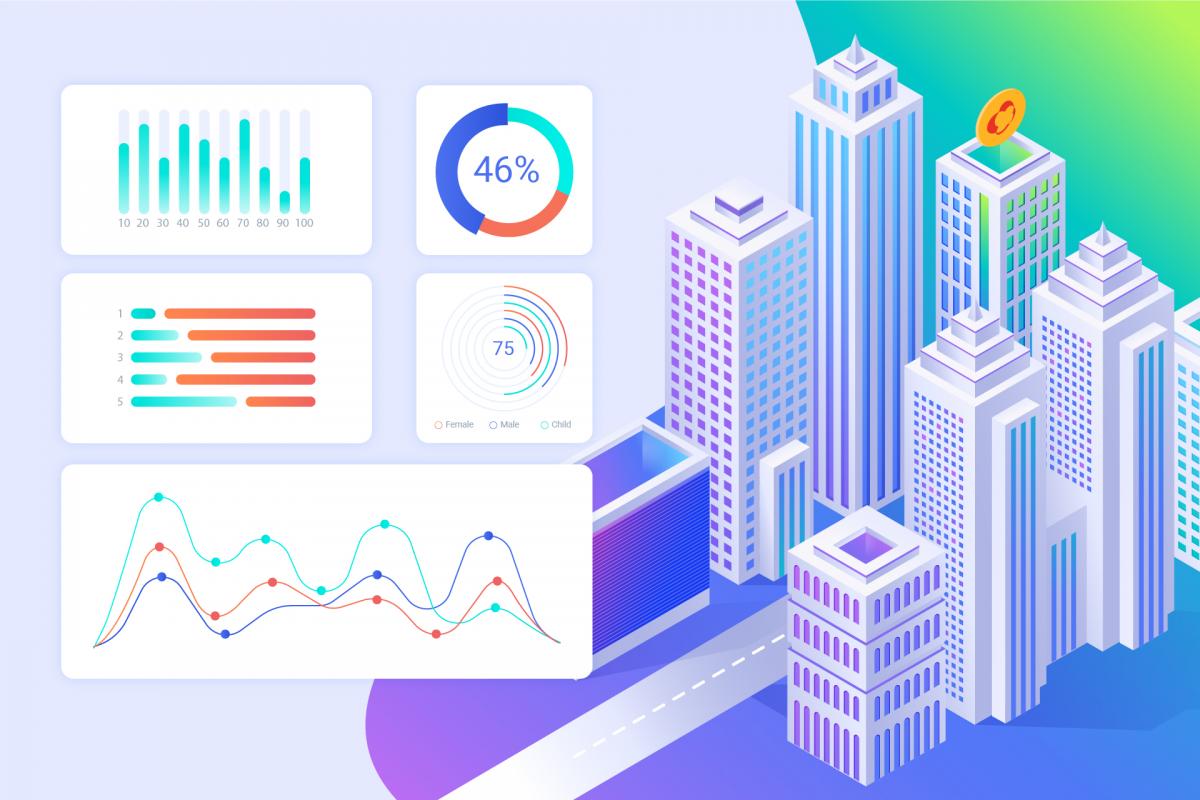
The results of data analysis can be easily interpreted with the help of interactive maps and graphs, while a personalised dashboard provides the user with tools for comparing key figures from different time periods and/or locations; if needed, statistical reports can be downloaded in a form of an Excel spreadsheet or a PDF file as well. Despite the generous amount of functionalities, the application doesn’t overwhelm the user – instead, its sleek and somewhat minimalist design allows you to get right down to business without having to read through millions of instructions: just pick a place, select the parameters you like, press Enter – and explore!
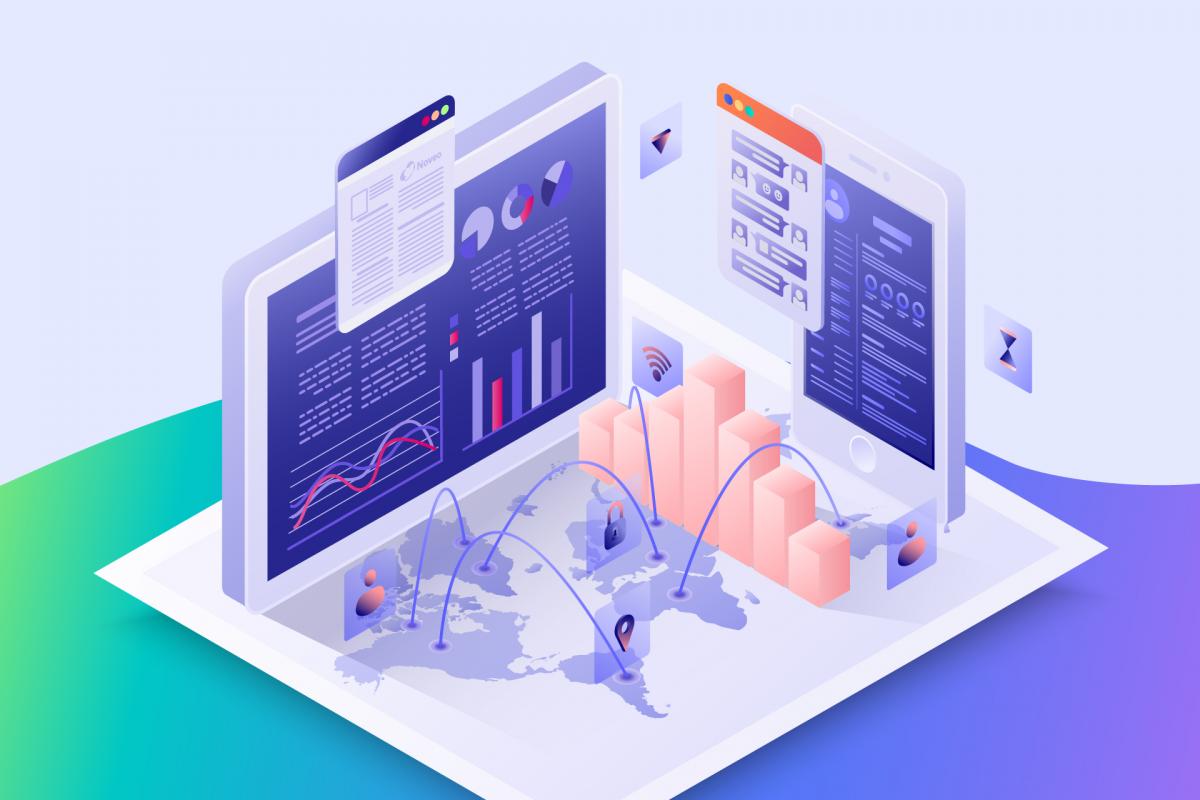
Together with the customer’s team, Noveo frontend developers keep improving the platform and implementing new features:
- different ways of visualising vehicle and pedestrian flows in selected locations;
- comparing and filtering data according to multiple parameters (footfall, demographics, etc.);
- prediction of cannibalisation (reduction of a company’s sales volume/revenue following the launch of a product that is similar to the already existing one), etc.
Plus, our teams ensure that the project stays up to date as time goes by; for example, the developers have performed refactoring of server queries and switched over to React Query, have changed their approach to styling – and to coding in general – thus making sure that everyone follows the latest recommendations and best practices in their respective domains.
Of course, we encountered some difficulties along the way, such as figuring out how to replace a library for displaying complex graphs without breaking everything else (mind you, at first it seemed like there were not that many dependencies – but alas!), having to adapt to the new requirements when the team was already halfway done with the task, looking for alternative solutions here and there… As it usually happens, though, some research and a couple of brainstorming sessions helped us to find the right answer and finally beat the metaphorical puzzle!
As our project with the customer progresses, our tasks continue to get trickier – but where’s the fun when there’s no challenge? ;) Let’s keep on exploring the world – and this time around, it‘s going to be by visiting European streets online!